HOT TOPICS LIST
- MACD
- Fibonacci
- RSI
- Gann
- ADXR
- Stochastics
- Volume
- Triangles
- Futures
- Cycles
- Volatility
- ZIGZAG
- MESA
- Retracement
- Aroon
INDICATORS LIST
LIST OF TOPICS
PRINT THIS ARTICLE
by David Penn
Do oversold readings in October cotton make the case for value--or merely further declines?
Position: N/A
David Penn
Technical Writer for Technical Analysis of STOCKS & COMMODITIES magazine, Working-Money.com, and Traders.com Advantage.
PRINT THIS ARTICLE
OVERBOUGHT OVERSOLD
Summertime ... And The Cotton Is Slipping ...
07/25/05 12:52:31 PMby David Penn
Do oversold readings in October cotton make the case for value--or merely further declines?
Position: N/A
| The fish might be jumpin', but the cotton is anything but high. At least not as far as cotton futures are concerned. Who knows what is pressuring cotton. One guess might be the threat of a free-trade agreement that would include ending price supports for American cotton farmers. The Guardian newspaper reported recently that American cotton farmers receive more than three billion dollars a year in subsidies that allegedly encourage overproduction and chronically weak prices for the commodity--a staple export of many developing nations such as Pakistan and Mali. |
| Interesting--but another reason why I prefer technicals to fundamentals. None of the above explains why cotton prices are particularly weak now. |

|
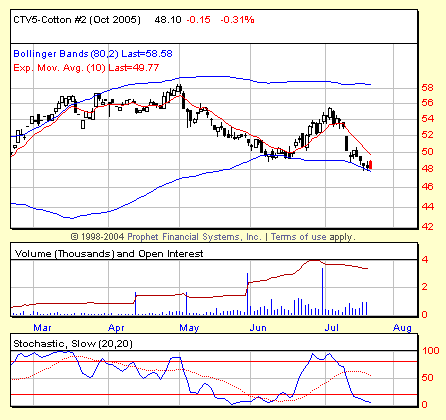
| Figure 1: The last time October cotton became oversold (basis stochastic) it lost about three cents before that oversold condition ended a month later. Each cent in cotton futures is worth $500. |
| Graphic provided by: Prophet Financial, Inc. |
| |
| That said, cotton has juked me more than once in 2005. In early April, a 2B test of top ("Cotton Comes Down," Traders.com Advantage; April 1, 2005) suggested lower prices, then late in April, an ascending triangle ("July Cotton's Ascending Triangle Breakout," Traders.com Advantage; April 26, 2005) suggested that, no, higher prices for cotton were in store. |
| The "tie" went to the bears this time, as the breakout from that ascending triangle failed, sending cotton prices into an abrupt reversal. For the next six weeks cotton futures continued to retreat, becoming oversold in mid-May and remaining so until mid-June (three cents and some $1500 later). A positive stochastic divergence that had been developing since mid-May finally resulted in a bounce in mid-June as well, sending cotton futures on a quick five-cent ride higher going into earliest July. |
| But the bear, as they say, is back. In a little over two weeks the bears in October cotton have taken back those five cents and then some, sending the futures down below the closing lows of June. This time, not only has October cotton become oversold, but prices have also begun to drag down the lower band of the long-term Bollinger Bands. This could be significant for two reasons. First, if the Bollinger Bands expand over the next several weeks relative to the compression of June, then October cotton should see the kind of volatility that truly makes a commodity worth trading. Second, the fact that it is the lower Bollinger Band (and, again, a longer-term Bollinger Band based on the 80-bar EMA rather than the standard 20-bar) that is being "bent" lower suggests strongly that any volatility in the near-term will more likely take prices lower rather than higher. |
Technical Writer for Technical Analysis of STOCKS & COMMODITIES magazine, Working-Money.com, and Traders.com Advantage.
| Title: | Technical Writer |
| Company: | Technical Analysis, Inc. |
| Address: | 4757 California Avenue SW |
| Seattle, WA 98116 | |
| Phone # for sales: | 206 938 0570 |
| Fax: | 206 938 1307 |
| Website: | www.Traders.com |
| E-mail address: | DPenn@traders.com |
Traders' Resource Links | |
| Charting the Stock Market: The Wyckoff Method -- Books | |
| Working-Money.com -- Online Trading Services | |
| Traders.com Advantage -- Online Trading Services | |
| Technical Analysis of Stocks & Commodities -- Publications and Newsletters | |
| Working Money, at Working-Money.com -- Publications and Newsletters | |
| Traders.com Advantage -- Publications and Newsletters | |
| Professional Traders Starter Kit -- Software | |
Click here for more information about our publications!
Comments
Date: 07/26/05Rank: 2Comment:

Request Information From Our Sponsors
- VectorVest, Inc.
- Executive Premier Workshop
- One-Day Options Course
- OptionsPro
- Retirement Income Workshop
- Sure-Fire Trading Systems (VectorVest, Inc.)
- Trading as a Business Workshop
- VectorVest 7 EOD
- VectorVest 7 RealTime/IntraDay
- VectorVest AutoTester
- VectorVest Educational Services
- VectorVest OnLine
- VectorVest Options Analyzer
- VectorVest ProGraphics v6.0
- VectorVest ProTrader 7
- VectorVest RealTime Derby Tool
- VectorVest Simulator
- VectorVest Variator
- VectorVest Watchdog
- StockCharts.com, Inc.
- Candle Patterns
- Candlestick Charting Explained
- Intermarket Technical Analysis
- John Murphy on Chart Analysis
- John Murphy's Chart Pattern Recognition
- John Murphy's Market Message
- MurphyExplainsMarketAnalysis-Intermarket Analysis
- MurphyExplainsMarketAnalysis-Visual Analysis
- StockCharts.com
- Technical Analysis of the Financial Markets
- The Visual Investor
