HOT TOPICS LIST
- MACD
- Fibonacci
- RSI
- Gann
- ADXR
- Stochastics
- Volume
- Triangles
- Futures
- Cycles
- Volatility
- ZIGZAG
- MESA
- Retracement
- Aroon
INDICATORS LIST
LIST OF TOPICS
PRINT THIS ARTICLE
by Koos van der Merwe
You read Stocks & Commodities magazine every month, perhaps searching for the "Holy Grail" of trading. If so, here is a suggestion for finding that cherished cup.
Position: Hold
Koos van der Merwe
Has been a technical analyst since 1969, and has worked as a futures and options trader with First Financial Futures in Johannesburg, South Africa.
PRINT THIS ARTICLE
TECHNICAL INDICATORS
An Analysis For Lionbridge Technologies Inc.
07/25/05 01:50:21 PMby Koos van der Merwe
You read Stocks & Commodities magazine every month, perhaps searching for the "Holy Grail" of trading. If so, here is a suggestion for finding that cherished cup.
Position: Hold
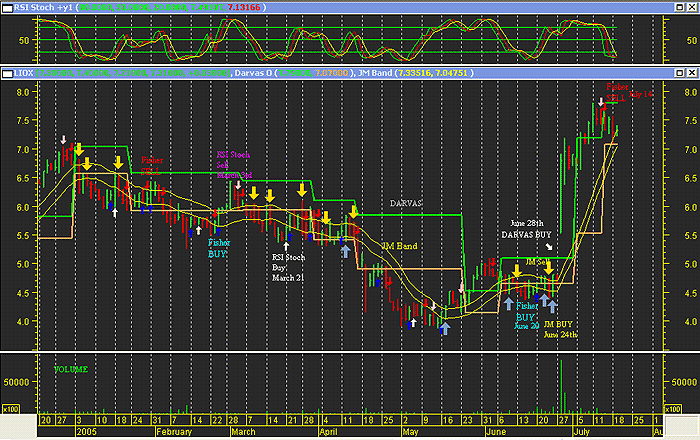
| The chart below is of Lionbridge Technologies. Inc (LIO-T). The share was chosen using the strategy developed by Markos Katsanos in his article "Detecting Breakouts From Flags & Pennants," (Stocks & Commodities, May 2005). I have found it very useful in identifying shares that could be future buys. Once identified, I then examine the stock using the following indicators found in MetaStock's Expert Advisor. (You are welcome to email me for any Metastock formulas.) This has given me the various buy and sell signals on the chart. I shall discuss each in turn. |

|
| |
| There are two channels on the chart, the Darvas channel (Stocks & Commodities, May 2005 by Daryl Guppy) and the JM Internal Band channel. The JM Internal Band signals have been incorporated into the Expert Advisor as well, and the larger arrows on the chart are its buy and sell signals. |
| 1. A Darvas buy occurs when the price closes above the upper Darvas channel line (thick green line). Lionbridge gave a Darvas buy on June 28th, and has remained a buy signal since. A Darvas sell signal occurs when the price closes below the lower Darvas band, shown in the thick peach on the chart. 2. The JM internal band (peach, thin channel) is a 15-period moving average offset by 2% positive and 2% negative. The JM internal band buy and sell signals are shown by the larger light blue and mustard arrows on the chart. Note that the JM internal band buy signal was two days earlier than the Darvas channel buy signal. The JM signals were extremely volatile with a buy and sell signal being triggered within 12 days of each other. You would therefore look at the indicator, an RSI/stochastic as a pacifier. The extreme volatility, in this instance, would cause you to prefer the Darvas trading strategy, and lend credence to it, or, you could adjust the parameters of the JM internal band, in this instance to 4% and -4%. 3. Fisher transform ( Stocks & Commodities, November 2002 by John Ehlers). I have shown the Fisher buy and sell signals with the small blue and red arrows. Note the Fisher buy signal on June 20th, and the sell signal on July 14th. Remember that the Fisher signals are more volatile than the Darvas or JM internal band signals, good for a trader who pays low commissions. However, they can be used in conjunction with the Darvas or JM internal band strategy to take you in or out of the share earlier than either band; buy only if you are convinced that a buy signal is imminent. 4. Finally, I have included the signal for the RSI stochastic indicator in the Expert Advisor. The buy signal is the white arrow, and the sell signal is the pink arrow. I use this signal as a confirmation to all other signals. At the moment, both the Darvas and JM internal bands are positive, but sell signals have been received by the RSI stochastic indicator and the Fisher transform indicator. |
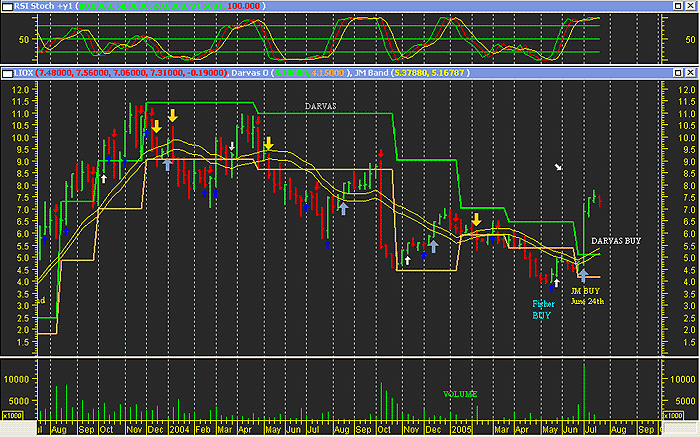
| Finally, I will look at the weekly chart for confirmation. At the moment the weekly chart gives a JM internal band buy and a Darvas buy. A Fisher transform buy was triggered five weeks earlier, and a RSI stochastic buy four weeks earlier. The RSI stochastic indicator is overbought, but has not given a sell signal. |

|
| Lion Bridge and it's charts. |
| Graphic provided by: MetaStock. |
| |
| With a bullish weekly chart, I would be waiting for a Fisher transform buy signal on the daily chart. This may be a short-term trading opportunity -- short-term because the weekly RSI stochastic indicator suggests it is overbought, and could give a sell signal at any moment. Should the weekly chart give me a sell signal with any one of the above indicators, I would not buy the stock, but wait for the weekly chart to give me a buy signal when I would look for a buy signal in the daily chart. Is this the Holy Grail? I doubt it, but it does increase the odds on your side. |
Has been a technical analyst since 1969, and has worked as a futures and options trader with First Financial Futures in Johannesburg, South Africa.
| Address: | 3256 West 24th Ave |
| Vancouver, BC | |
| Phone # for sales: | 6042634214 |
| E-mail address: | petroosp@gmail.com |
Click here for more information about our publications!
Comments
Date: 07/26/05Rank: 3Comment:

Request Information From Our Sponsors
- StockCharts.com, Inc.
- Candle Patterns
- Candlestick Charting Explained
- Intermarket Technical Analysis
- John Murphy on Chart Analysis
- John Murphy's Chart Pattern Recognition
- John Murphy's Market Message
- MurphyExplainsMarketAnalysis-Intermarket Analysis
- MurphyExplainsMarketAnalysis-Visual Analysis
- StockCharts.com
- Technical Analysis of the Financial Markets
- The Visual Investor
- VectorVest, Inc.
- Executive Premier Workshop
- One-Day Options Course
- OptionsPro
- Retirement Income Workshop
- Sure-Fire Trading Systems (VectorVest, Inc.)
- Trading as a Business Workshop
- VectorVest 7 EOD
- VectorVest 7 RealTime/IntraDay
- VectorVest AutoTester
- VectorVest Educational Services
- VectorVest OnLine
- VectorVest Options Analyzer
- VectorVest ProGraphics v6.0
- VectorVest ProTrader 7
- VectorVest RealTime Derby Tool
- VectorVest Simulator
- VectorVest Variator
- VectorVest Watchdog
