HOT TOPICS LIST
- MACD
- Fibonacci
- RSI
- Gann
- ADXR
- Stochastics
- Volume
- Triangles
- Futures
- Cycles
- Volatility
- ZIGZAG
- MESA
- Retracement
- Aroon
INDICATORS LIST
LIST OF TOPICS
PRINT THIS ARTICLE
by Arthur Hill
After a big fall from grace last year, Krispy Kreme (KKD) consolidated in 2005 and things could liven up soon.
Position: Hold
Arthur Hill
Arthur Hill is currently editor of TDTrader.com, a website specializing in trading strategies, sector/industry specific breadth stats and overall technical analysis. He passed the Society of Technical Analysts (STA London) diploma exam with distinction is a Certified Financial Technician (CFTe). Prior to TD Trader, he was the Chief Technical Analyst for Stockcharts.com and the main contributor to the ChartSchool.
PRINT THIS ARTICLE
TRIANGLES
Krispy Kreme Turns Dull
07/20/05 09:28:36 AMby Arthur Hill
After a big fall from grace last year, Krispy Kreme (KKD) consolidated in 2005 and things could liven up soon.
Position: Hold
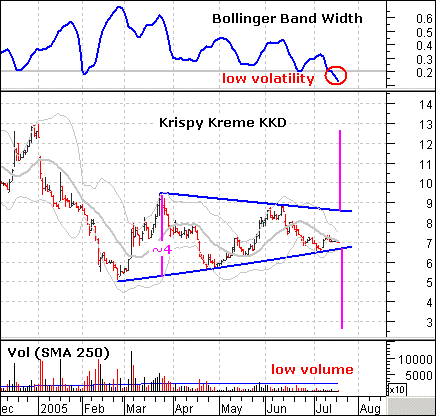
| KKD fell from 40 to 10 in 2004 and then from 12 to 5 at the beginning of 2005. The stock reached its low in February and formed a triangle over the last five months or so. The lower trendline extends up from the February low and the upper trendline extends down from the March high. |
| In addition to the narrowing trendlines, Bollinger Band width is at its lowest level of the year (red oval). This means that volatility has decreased to the point that usually leads to a significant move in the stock. |

|
| Graphic provided by: MetaStock. |
| Graphic provided by: Reuters Data. |
| |
| The Bollinger Bands are not good for directional clues and traders must turn to the triangle trendlines for a signal. A break below the lower trendline would argue for further weakness and at least a test of the prior low (~5). A break above the upper trendline would be bullish and argue for a test of the January high. |
| Triangle projections can also be made using the width of the pattern. The pattern is about 4 points wide in March. This amount would be added to the breakout point for an upside projection and subtracted from a break point for a downside projection. The downside projection is below 3 and the upside projection is above 12.5. Look for volume to confirm any breakout. |
Arthur Hill is currently editor of TDTrader.com, a website specializing in trading strategies, sector/industry specific breadth stats and overall technical analysis. He passed the Society of Technical Analysts (STA London) diploma exam with distinction is a Certified Financial Technician (CFTe). Prior to TD Trader, he was the Chief Technical Analyst for Stockcharts.com and the main contributor to the ChartSchool.
| Title: | Editor |
| Company: | TDTrader.com |
| Address: | Willem Geetsstraat 17 |
| Mechelen, B2800 | |
| Phone # for sales: | 3215345465 |
| Website: | www.tdtrader.com |
| E-mail address: | arthurh@tdtrader.com |
Traders' Resource Links | |
| TDTrader.com has not added any product or service information to TRADERS' RESOURCE. | |
Click here for more information about our publications!
Comments
Date: 07/20/05Rank: 4Comment:
Date: 07/21/05Rank: 4Comment:

Request Information From Our Sponsors
- StockCharts.com, Inc.
- Candle Patterns
- Candlestick Charting Explained
- Intermarket Technical Analysis
- John Murphy on Chart Analysis
- John Murphy's Chart Pattern Recognition
- John Murphy's Market Message
- MurphyExplainsMarketAnalysis-Intermarket Analysis
- MurphyExplainsMarketAnalysis-Visual Analysis
- StockCharts.com
- Technical Analysis of the Financial Markets
- The Visual Investor
- VectorVest, Inc.
- Executive Premier Workshop
- One-Day Options Course
- OptionsPro
- Retirement Income Workshop
- Sure-Fire Trading Systems (VectorVest, Inc.)
- Trading as a Business Workshop
- VectorVest 7 EOD
- VectorVest 7 RealTime/IntraDay
- VectorVest AutoTester
- VectorVest Educational Services
- VectorVest OnLine
- VectorVest Options Analyzer
- VectorVest ProGraphics v6.0
- VectorVest ProTrader 7
- VectorVest RealTime Derby Tool
- VectorVest Simulator
- VectorVest Variator
- VectorVest Watchdog
