HOT TOPICS LIST
- MACD
- Fibonacci
- RSI
- Gann
- ADXR
- Stochastics
- Volume
- Triangles
- Futures
- Cycles
- Volatility
- ZIGZAG
- MESA
- Retracement
- Aroon
INDICATORS LIST
LIST OF TOPICS
PRINT THIS ARTICLE
by Arthur Hill
Stocks continue to march higher as volatility continues to move lower.
Position: Hold
Arthur Hill
Arthur Hill is currently editor of TDTrader.com, a website specializing in trading strategies, sector/industry specific breadth stats and overall technical analysis. He passed the Society of Technical Analysts (STA London) diploma exam with distinction is a Certified Financial Technician (CFTe). Prior to TD Trader, he was the Chief Technical Analyst for Stockcharts.com and the main contributor to the ChartSchool.
PRINT THIS ARTICLE
SENTIMENT INDEX
VIX Confirms Strength In S&P 100
07/18/05 01:44:16 PMby Arthur Hill
Stocks continue to march higher as volatility continues to move lower.
Position: Hold
| The CBOE Volatility Index (VIX) measures the implied volatility for a basket of S&P 100 puts and calls. Volatility increases when perceived risk increases, and volatility decreases when perceived risk decreases. |

|
| Graphic provided by: MetaStock. |
| Graphic provided by: Reuters Data. |
| |
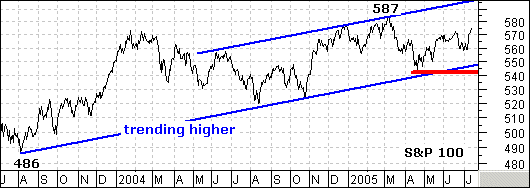
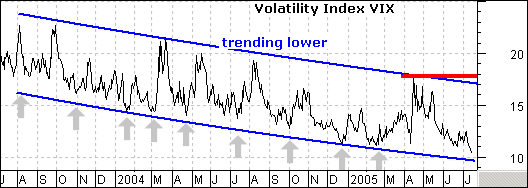
| The VIX has been trending lower for about three years. In contrast, the S&P 100 has been trending higher since October 2002. There is clearly a well-established inverse relationship. As long as the VIX trends lower and within the falling price channel, we should expect the S&P 100 to trend higher and hold the trendline extending up from August 2004. |

|
| Graphic provided by: MetaStock. |
| Graphic provided by: Reuters Data. |
| |
| There is a school of thought that considers a low VIX as a sign of complacency. This was the case with each low (gray arrows). There were calls for complacency the first time VIX moved below 20. Investors became more and more complacent as VIX moved even lower, but the S&P 100 just kept on moving higher. Perhaps a low VIX simply reflects less volatility. That may sound obvious, but low volatility means less perceived risk and a better environment for stocks. |
| Until the VIX breaks the upper trendline of the falling price channel and exceeds the April 2005 high of 18, volatility and risk are moving lower. Even though the pace may slow, this means that stocks should continue to move higher. |
Arthur Hill is currently editor of TDTrader.com, a website specializing in trading strategies, sector/industry specific breadth stats and overall technical analysis. He passed the Society of Technical Analysts (STA London) diploma exam with distinction is a Certified Financial Technician (CFTe). Prior to TD Trader, he was the Chief Technical Analyst for Stockcharts.com and the main contributor to the ChartSchool.
| Title: | Editor |
| Company: | TDTrader.com |
| Address: | Willem Geetsstraat 17 |
| Mechelen, B2800 | |
| Phone # for sales: | 3215345465 |
| Website: | www.tdtrader.com |
| E-mail address: | arthurh@tdtrader.com |
Traders' Resource Links | |
| TDTrader.com has not added any product or service information to TRADERS' RESOURCE. | |
Click here for more information about our publications!
Comments
Date: 07/19/05Rank: 5Comment:
Date: 07/19/05Rank: 4Comment:

|

Request Information From Our Sponsors
- VectorVest, Inc.
- Executive Premier Workshop
- One-Day Options Course
- OptionsPro
- Retirement Income Workshop
- Sure-Fire Trading Systems (VectorVest, Inc.)
- Trading as a Business Workshop
- VectorVest 7 EOD
- VectorVest 7 RealTime/IntraDay
- VectorVest AutoTester
- VectorVest Educational Services
- VectorVest OnLine
- VectorVest Options Analyzer
- VectorVest ProGraphics v6.0
- VectorVest ProTrader 7
- VectorVest RealTime Derby Tool
- VectorVest Simulator
- VectorVest Variator
- VectorVest Watchdog
- StockCharts.com, Inc.
- Candle Patterns
- Candlestick Charting Explained
- Intermarket Technical Analysis
- John Murphy on Chart Analysis
- John Murphy's Chart Pattern Recognition
- John Murphy's Market Message
- MurphyExplainsMarketAnalysis-Intermarket Analysis
- MurphyExplainsMarketAnalysis-Visual Analysis
- StockCharts.com
- Technical Analysis of the Financial Markets
- The Visual Investor
