HOT TOPICS LIST
- MACD
- Fibonacci
- RSI
- Gann
- ADXR
- Stochastics
- Volume
- Triangles
- Futures
- Cycles
- Volatility
- ZIGZAG
- MESA
- Retracement
- Aroon
INDICATORS LIST
LIST OF TOPICS
PRINT THIS ARTICLE
by Ashwani Gujral
Gold moves into a medium-term consolidation but maintains its uptrend. If it can move above 445, it could then move to 496.
Position: Buy
Ashwani Gujral
He is founder of AGIP Securities Pvt. Ltd. which offers money management services, live chat rooms (during market hours) and independent technical analysis consultancy. The company has a big media presence from the likes of CNBC, NDTV Profit, and ZEE Business.
PRINT THIS ARTICLE
CONSOLID FORMATION
Gold Consolidates But Remains In An Uptrend
07/18/05 03:40:33 PMby Ashwani Gujral
Gold moves into a medium-term consolidation but maintains its uptrend. If it can move above 445, it could then move to 496.
Position: Buy
| Consolidations occur between trends moving on any time frame. These consolidations offer the opportunity to new buyers to enter trends while the current holders book some profits. All trends end as consolidations, while some consolidations end as continuations of the prior trend and others end as distribution patterns. Three quarters of all consolidations lead to a continuation of the trend, and only 25% lead to a reversal. Traders should not preempt a breakout from a consolidation, though they can figure out the lowest-risk entries into a trend within a consolidation. Once the boundary of a consolidation is formed, oscillators can be used to enter at the lower end of consolidation, with the stop being the lower boundary. The assumption here is that the trend will continue unless proven otherwise. |

|
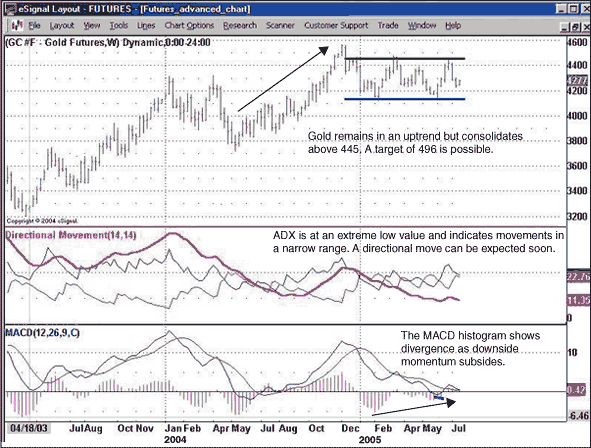
| Fig 1: Weekly chart of gold |
| Graphic provided by: eSignal. |
| |
| On the weekly chart of gold, we see a sideways consolidation between 410 and 443 after an uptrend. The ADX has declined to very low levels of 11-12, which shows that an uptick in the indicator would lead to a new trending move. The MACD histogram shows a divergence from price as it forms a higher bottom, indicating the next move could be upward. The target is calculated by measuring the prior move from 370 to 456, and then adding the difference (86) to 410, the bottom of the consolidation, to arrive at 496. This scenario works out after the upper end of the range, that is, the 445 level is crossed decisively. |

|
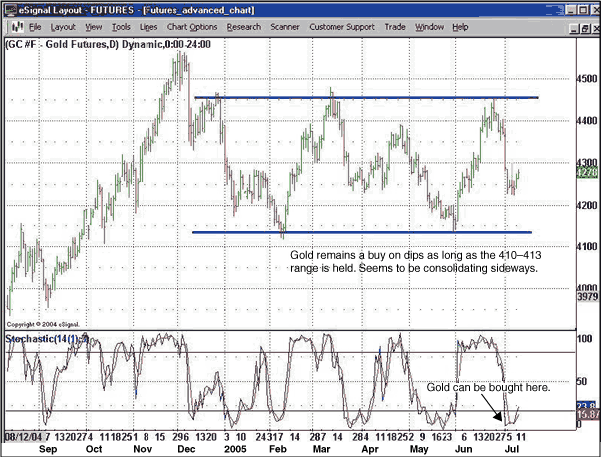
| Fig 2: Daily chart of gold |
| Graphic provided by: eSignal. |
| |
| On the daily chart, we see that gold has held support at 410-413 twice and again corrects to about 425 as the stochastic oscillator corrects all the way down and starts moving up again. This indicates that the current downmove to 425 was a reaction, and gold could move back to 445 and then towards a daily target of 480. I arrived at this projection by extrapolating the width of the triangle on the upper boundary of the consolidation, (445+(445-410)). Now the risk of this trade is clearly defined, with 410 being the stop-loss, 425 being the entry, and with price targets of 445, 480, and then 496. |
He is founder of AGIP Securities Pvt. Ltd. which offers money management services, live chat rooms (during market hours) and independent technical analysis consultancy. The company has a big media presence from the likes of CNBC, NDTV Profit, and ZEE Business.
| Title: | Chief mkt strategist |
| Company: | AGIP Securities |
| India | |
| Phone # for sales: | 9871066337 |
| Website: | www.ashwanigujral.com |
| E-mail address: | contact@ashwanigujral.com |
Traders' Resource Links | |
| AGIP Securities has not added any product or service information to TRADERS' RESOURCE. | |
Click here for more information about our publications!
Comments
Date: 07/19/05Rank: 5Comment:
Date: 07/19/05Rank: 5Comment:
Date: 07/19/05Rank: 4Comment:

Request Information From Our Sponsors
- VectorVest, Inc.
- Executive Premier Workshop
- One-Day Options Course
- OptionsPro
- Retirement Income Workshop
- Sure-Fire Trading Systems (VectorVest, Inc.)
- Trading as a Business Workshop
- VectorVest 7 EOD
- VectorVest 7 RealTime/IntraDay
- VectorVest AutoTester
- VectorVest Educational Services
- VectorVest OnLine
- VectorVest Options Analyzer
- VectorVest ProGraphics v6.0
- VectorVest ProTrader 7
- VectorVest RealTime Derby Tool
- VectorVest Simulator
- VectorVest Variator
- VectorVest Watchdog
- StockCharts.com, Inc.
- Candle Patterns
- Candlestick Charting Explained
- Intermarket Technical Analysis
- John Murphy on Chart Analysis
- John Murphy's Chart Pattern Recognition
- John Murphy's Market Message
- MurphyExplainsMarketAnalysis-Intermarket Analysis
- MurphyExplainsMarketAnalysis-Visual Analysis
- StockCharts.com
- Technical Analysis of the Financial Markets
- The Visual Investor
