HOT TOPICS LIST
- MACD
- Fibonacci
- RSI
- Gann
- ADXR
- Stochastics
- Volume
- Triangles
- Futures
- Cycles
- Volatility
- ZIGZAG
- MESA
- Retracement
- Aroon
INDICATORS LIST
LIST OF TOPICS
PRINT THIS ARTICLE
by Koos van der Merwe
Markos Katsanos has written a number of articles for Technical Analysis of STOCKS & COMMODITIES magazine demonstrating various strategies that I have found interesting. The strategy I'll use here to identify this stock is his flag and pennant recognition system, based on his article published in the May 2005 issue of STOCKS & COMMODITIES.
Position: N/A
Koos van der Merwe
Has been a technical analyst since 1969, and has worked as a futures and options trader with First Financial Futures in Johannesburg, South Africa.
PRINT THIS ARTICLE
FLAGS AND PENNANTS
Viva Vivus!
07/15/05 11:50:50 AMby Koos van der Merwe
Markos Katsanos has written a number of articles for Technical Analysis of STOCKS & COMMODITIES magazine demonstrating various strategies that I have found interesting. The strategy I'll use here to identify this stock is his flag and pennant recognition system, based on his article published in the May 2005 issue of STOCKS & COMMODITIES.
Position: N/A
| Vivus Inc. (VVUS) develops therapies for the treatment of sexual dysfunction and urologic disorders in men and women. The company has developed two products to treat erectile dysfunction, which they market with Abbott Laboratories. |

|
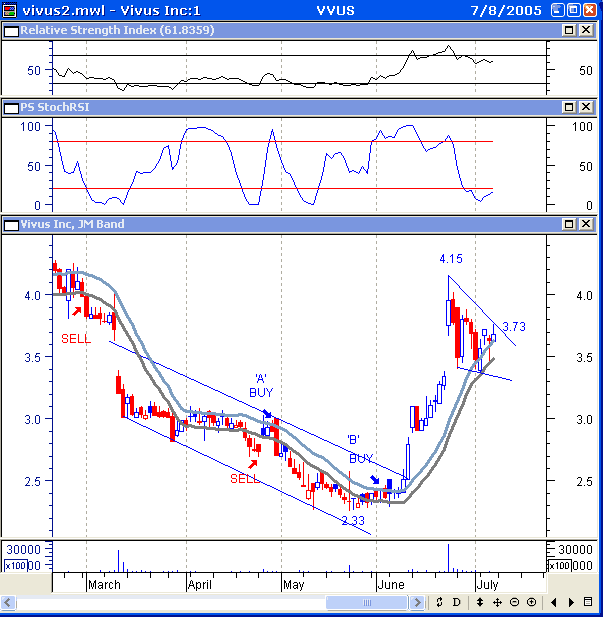
| A 2005 chart of Vivus (VVUS) with various indicators. |
| Graphic provided by: MetaStock. |
| |
| I identified this stock as a potential breakout candidate by using Katsanos's pattern-recognition formula that I programmed into MetaStock Explorer. The candlestick chart of Vivus includes various indicators that could be used to help decide whether to buy, including RSI, stochastics, and JM bands. |
| The chart shows how the price has moved up strongly from a low of $2.33 in May 2005 to a high of $4.15 by mid-June. The stock has now formed what looks like a pennant, with a move above the upper resistance line suggesting a target of $5.97 (4.15 - 2.33 = 1.82 + 4.15 = 5.97). |

|
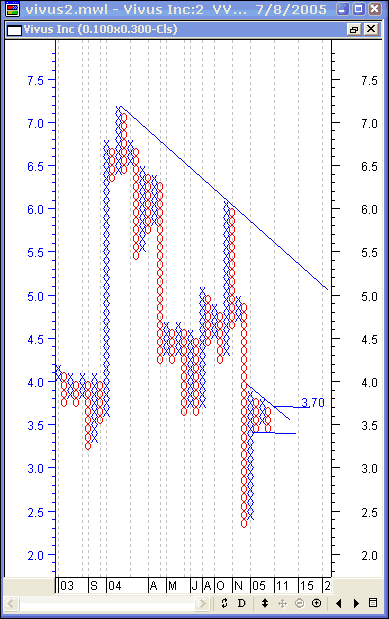
| This point & figure chart of the close uses a three-box reversal. I calculate my target to be between $5.50 and $5.97. |
| Graphic provided by: MetaStock. |
| |
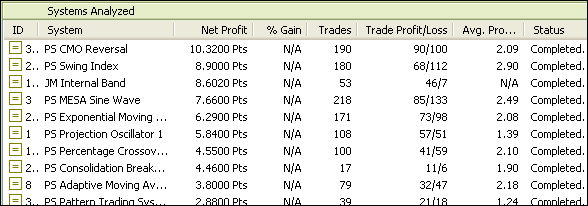
| This point & figure chart of the close is a three-box reversal with a box size of 0.10. Using a horizontal count to determine a target, I reach a target of $5.50. (A move up will give six columns, x 3 = 18 x 0.1 = 1.8 + 3.70 = $5.50.) The target could then be between $5.50 and $5.97. On the candlestick chart, I have drawn in some JM internal bands. JM internal bands are a 15-period moving average with a 2% positive and negative offset. Using the Advanced Explorer of MetaStock, I tested Vivus across a number of strategies. The JM strategy gave the third most profitable results, but was first in the smallest number of trades made. |

|
| I used MetaStock's Advanced Explorer to identify the best system to use on Vivus Inc. I ran the test on more than 400 days of data. Note that the JM internal band gave 8.602 points on 53 trades, compared to 190 trades for the strategy that offered the most points. Commissions paid would hurt this trade. |
| Graphic provided by: MetaStock. |
| |
| Finally, note the two indicators plotted with the candlestick chart. The upper pane shows the RSI (14) suggesting weakness ahead, while the middle pane shows the stochastic RSI suggesting strength -- a conflict of indicators. The pennant that could have formed is therefore the most obvious trigger -- that is, if you didn't already purchase the stock when the JM internal band signaled a buy. At the moment, the breakout level -- namely the upper resistance line -- is $3.73, with a move above the pivot point being a confirmation. |
Has been a technical analyst since 1969, and has worked as a futures and options trader with First Financial Futures in Johannesburg, South Africa.
| Address: | 3256 West 24th Ave |
| Vancouver, BC | |
| Phone # for sales: | 6042634214 |
| E-mail address: | petroosp@gmail.com |
Click here for more information about our publications!
Comments
Date: 07/19/05Rank: 2Comment:

Request Information From Our Sponsors
- StockCharts.com, Inc.
- Candle Patterns
- Candlestick Charting Explained
- Intermarket Technical Analysis
- John Murphy on Chart Analysis
- John Murphy's Chart Pattern Recognition
- John Murphy's Market Message
- MurphyExplainsMarketAnalysis-Intermarket Analysis
- MurphyExplainsMarketAnalysis-Visual Analysis
- StockCharts.com
- Technical Analysis of the Financial Markets
- The Visual Investor
- VectorVest, Inc.
- Executive Premier Workshop
- One-Day Options Course
- OptionsPro
- Retirement Income Workshop
- Sure-Fire Trading Systems (VectorVest, Inc.)
- Trading as a Business Workshop
- VectorVest 7 EOD
- VectorVest 7 RealTime/IntraDay
- VectorVest AutoTester
- VectorVest Educational Services
- VectorVest OnLine
- VectorVest Options Analyzer
- VectorVest ProGraphics v6.0
- VectorVest ProTrader 7
- VectorVest RealTime Derby Tool
- VectorVest Simulator
- VectorVest Variator
- VectorVest Watchdog
