

HOT TOPICS LIST
- MACD
- Fibonacci
- RSI
- Gann
- ADXR
- Stochastics
- Volume
- Triangles
- Futures
- Cycles
- Volatility
- ZIGZAG
- MESA
- Retracement
- Aroon
INDICATORS LIST
LIST OF TOPICS
PRINT THIS ARTICLE
by Arthur Hill
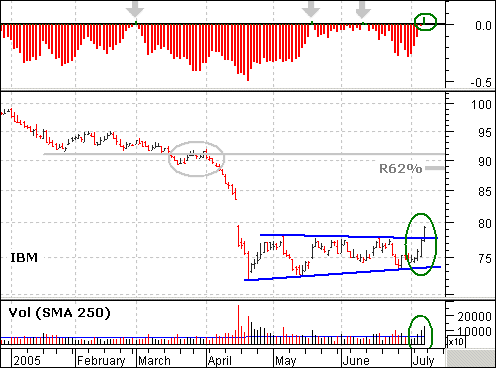
IBM is leading the market once again with a high-volume breakout.
Position: Buy
Arthur Hill
Arthur Hill is currently editor of TDTrader.com, a website specializing in trading strategies, sector/industry specific breadth stats and overall technical analysis. He passed the Society of Technical Analysts (STA London) diploma exam with distinction is a Certified Financial Technician (CFTe). Prior to TD Trader, he was the Chief Technical Analyst for Stockcharts.com and the main contributor to the ChartSchool.
PRINT THIS ARTICLE
TRIANGLES
Big Blue Makes A Big Break
07/15/05 02:05:13 PMby Arthur Hill
IBM is leading the market once again with a high-volume breakout.
Position: Buy
| On the price chart, IBM declined sharply in April 2005 and then began a long consolidation. A triangle evolved over the last few months as the stock digested the losses incurred from January to April. Triangles are neutral patterns that are dependent on a break for a directional signal. The move above the upper trendline and prior highs is bullish and opens the door to further strength. |
|
| Graphic provided by: MetaStock. |
| Graphic provided by: Reuters Data. |
| |
| Volume and money flow confirm strength. While volume on the broader market has been just average recently, IBM surged on the highest volume since mid-April. Also notice that volume expanded the last three days, and Chaikin money flow moved to its highest level of the year. Chaikin money flow had been negative for most of 2005 with just three minor blips into positive territory (gray arrows). The current one-day blip exceeded the prior blips, and buying pressure is clearly picking up. |
| The upside target is around 90. The first projection is based on a move to broken support around 91. Broken support levels often turn into resistance, and this was confirmed with the late March highs (gray oval). The second projection stems from a 62% retracement of the prior decline. The stock was clearly oversold in mid-April and worked off this condition with a long consolidation. The breakout turned the trend bullish, and we can now expect at least a retracement of the prior decline. A move below the late June low would negate the breakout and turn the trend bearish. |
Arthur Hill is currently editor of TDTrader.com, a website specializing in trading strategies, sector/industry specific breadth stats and overall technical analysis. He passed the Society of Technical Analysts (STA London) diploma exam with distinction is a Certified Financial Technician (CFTe). Prior to TD Trader, he was the Chief Technical Analyst for Stockcharts.com and the main contributor to the ChartSchool.
| Title: | Editor |
| Company: | TDTrader.com |
| Address: | Willem Geetsstraat 17 |
| Mechelen, B2800 | |
| Phone # for sales: | 3215345465 |
| Website: | www.tdtrader.com |
| E-mail address: | arthurh@tdtrader.com |
Traders' Resource Links | |
| TDTrader.com has not added any product or service information to TRADERS' RESOURCE. | |
Click here for more information about our publications!
Comments
Date:�07/15/05Rank:�4Comment:�

Request Information From Our Sponsors
- StockCharts.com, Inc.
- Candle Patterns
- Candlestick Charting Explained
- Intermarket Technical Analysis
- John Murphy on Chart Analysis
- John Murphy's Chart Pattern Recognition
- John Murphy's Market Message
- MurphyExplainsMarketAnalysis-Intermarket Analysis
- MurphyExplainsMarketAnalysis-Visual Analysis
- StockCharts.com
- Technical Analysis of the Financial Markets
- The Visual Investor
- VectorVest, Inc.
- Executive Premier Workshop
- One-Day Options Course
- OptionsPro
- Retirement Income Workshop
- Sure-Fire Trading Systems (VectorVest, Inc.)
- Trading as a Business Workshop
- VectorVest 7 EOD
- VectorVest 7 RealTime/IntraDay
- VectorVest AutoTester
- VectorVest Educational Services
- VectorVest OnLine
- VectorVest Options Analyzer
- VectorVest ProGraphics v6.0
- VectorVest ProTrader 7
- VectorVest RealTime Derby Tool
- VectorVest Simulator
- VectorVest Variator
- VectorVest Watchdog