HOT TOPICS LIST
- MACD
- Fibonacci
- RSI
- Gann
- ADXR
- Stochastics
- Volume
- Triangles
- Futures
- Cycles
- Volatility
- ZIGZAG
- MESA
- Retracement
- Aroon
INDICATORS LIST
LIST OF TOPICS
PRINT THIS ARTICLE
by Paolo Pezzutti
These patterns can help the trader understand market conditions.
Position: N/A
Paolo Pezzutti
Author of the book "Trading the US Markets - A Comprehensive Guide to US Markets for International Traders and Investors" - Harriman House (July 2008)
PRINT THIS ARTICLE
CHART ANALYSIS
One-Day Patterns: Thrust Days, Run Days, Wide-Ranging Days
07/19/05 12:23:53 PMby Paolo Pezzutti
These patterns can help the trader understand market conditions.
Position: N/A
| In his book, Schwager on Futures — Technical Analysis, Jack Schwager describes several one-day patterns. These patterns are not, by any means, able to provide completely clear indications as to what the future price changes will be. When put together, however, they are little flags that help the trader build a general picture of the market conditions. Of the patterns Schwager describes, some typical one-day patterns are spikes, gaps, and reversal days. In this article I will describe thrust days, run days, and wide-ranging days. All three indicate directionality and indicate that money from the public is entering the market. In addition, wide-ranging days also add information about increases in volatility. Of these three, thrust days are the most common, while wide-ranging days happen less frequently. Let's look at these patterns in detail. |
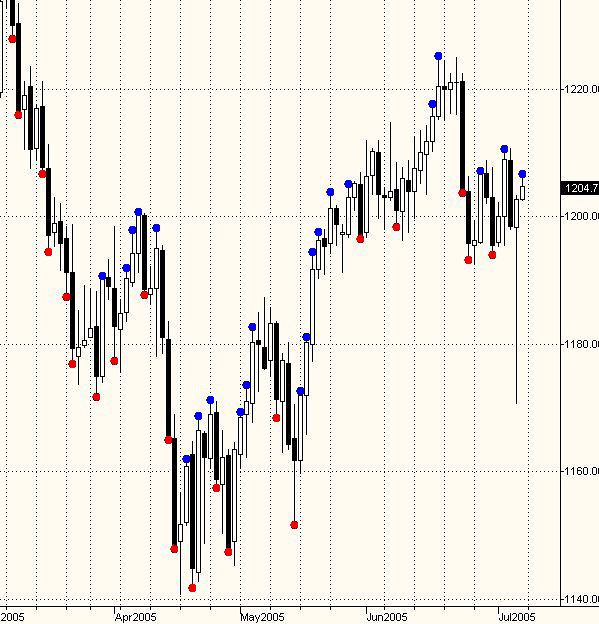
| Thrust days. When the close is above the previous day's high, you have an upthrust day. A downthrust day is a day in which the close is below the previous day's low. Thrust days are quite common, but a series of upthrust days indicates market strength, while a weak market is characterized by a series of downthrust days. During an uptrend, upthrust days outnumber downthrust days. During a downtrend, the opposite is true. You cannot define a trend based on a one-thrust day, but clusters of them can give you a good overview of the market trend. They can be useful in determining what short patterns to trade. In Figure 1, you can see the e-mini S&P daily chart. Note the frequent thrust days. |

|
| Figure 1. The e-mini daily chart displays the thrust days during the past four months. |
| Graphic provided by: TradeStation. |
| |
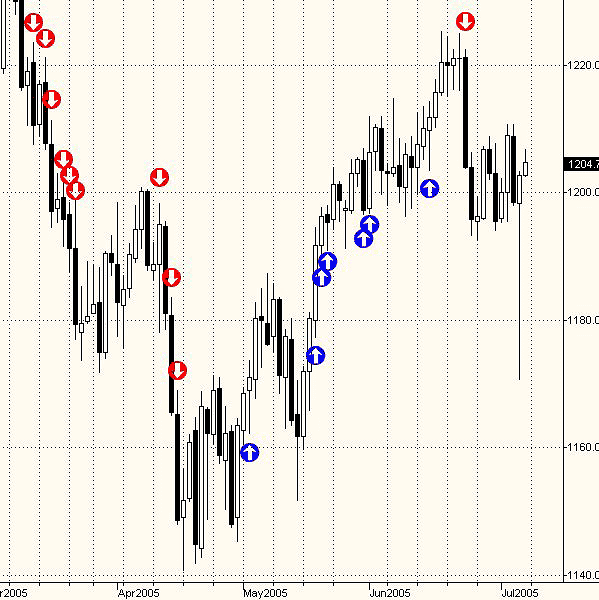
| Run days. An uprun day happens when: · the true high is greater than the maximum true high of the past n days; · the true low is lower the minimum true low of the subsequent n days. (The true high is the maximum of the current day's high and the previous day's close.) The opposite rule is valid for downrun days. Note that you can define a run day only after n days past its occurrence. The run day represents a trading day, and is more selective and more powerful than the upthrust day. Markets typically alternate between trends and congestions. Statistics say that markets spend longer periods of time developing congestions and trading ranges than trending, so the move to new areas of balance is fast and usually short. These short runs are where you will find the run day pattern. In Figure 2, you see the same chart used to display the thrust day example. Run days do not happen very often, and they introduce a significant lag (in the chart I used n=5). Run days very accurately indicate the ongoing trend, and can also be used to define the underlying market trend. |

|
| Figure 2. The same chart with the run days highlighted. Besides the lag they introduce, run days are quite useful to identify the underlying trend. |
| Graphic provided by: TradeStation. |
| |
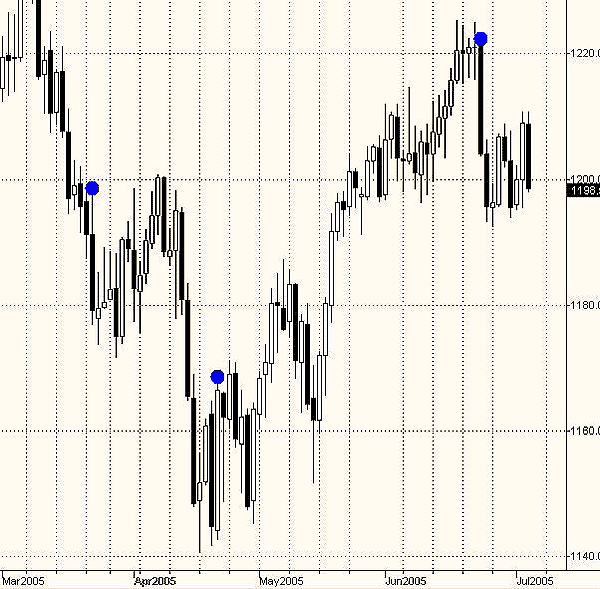
| Wide-ranging days. This pattern is very significant and is printed when volatility exceeds the average volatility of the past n days. In further detail, the trading day volatility ratio (VR), which is the true range divided by the true range of the past n-day period, has to be greater than k (e.g. k=2). Printed after a long decline, this pattern can signal the end of the downtrend. During an established trend, it indicates a further acceleration to set new highs. A wide-ranging day occurs when the public enters the market, bringing fresh money. It is a strong indication of the future market direction, and several short-term trading strategies are built around this pattern. The increase in volatility brings profitable trading opportunities. In Figure 3, you can see that wide-ranging days are quite rare. In the chart, I used k=1.8 and n=15. I believe this pattern's indications are very important: the high volatility increase indicates that the market sentiment has shifted quickly from one condition to another, with the public emotionally involved in the trading session. |

|
| Figure3. The wide-ranging days are less frequent. The volatility increase can help explain the market direction. |
| Graphic provided by: TradeStation. |
| |
| Markets alternate between trends and congestions, sometimes losing its balance and moving quickly to a new equilibrium area: that's when these one-day patterns are printed. The three patterns presented here have different strengths and significance, but their underlying meanings are the same — they hint at the direction of the markets. |
Author of the book "Trading the US Markets - A Comprehensive Guide to US Markets for International Traders and Investors" - Harriman House (July 2008)
| Address: | VIA ROBERTO AGO 26 POSTAL CODE 00166 |
| Rome, ITALY | |
| Phone # for sales: | +393357540708 |
| E-mail address: | pezzutti.paolo@tiscali.it |
Click here for more information about our publications!
Comments
Date: 07/19/05Rank: 5Comment:
Date: 07/19/05Rank: 3Comment:

Request Information From Our Sponsors
- StockCharts.com, Inc.
- Candle Patterns
- Candlestick Charting Explained
- Intermarket Technical Analysis
- John Murphy on Chart Analysis
- John Murphy's Chart Pattern Recognition
- John Murphy's Market Message
- MurphyExplainsMarketAnalysis-Intermarket Analysis
- MurphyExplainsMarketAnalysis-Visual Analysis
- StockCharts.com
- Technical Analysis of the Financial Markets
- The Visual Investor
- VectorVest, Inc.
- Executive Premier Workshop
- One-Day Options Course
- OptionsPro
- Retirement Income Workshop
- Sure-Fire Trading Systems (VectorVest, Inc.)
- Trading as a Business Workshop
- VectorVest 7 EOD
- VectorVest 7 RealTime/IntraDay
- VectorVest AutoTester
- VectorVest Educational Services
- VectorVest OnLine
- VectorVest Options Analyzer
- VectorVest ProGraphics v6.0
- VectorVest ProTrader 7
- VectorVest RealTime Derby Tool
- VectorVest Simulator
- VectorVest Variator
- VectorVest Watchdog
