HOT TOPICS LIST
- MACD
- Fibonacci
- RSI
- Gann
- ADXR
- Stochastics
- Volume
- Triangles
- Futures
- Cycles
- Volatility
- ZIGZAG
- MESA
- Retracement
- Aroon
INDICATORS LIST
LIST OF TOPICS
PRINT THIS ARTICLE
by Dennis D. Peterson
The rise and fall of equity prices can be seen as a battle between buyers and sellers that can reveal information on supply and demand.
Position: N/A
Dennis D. Peterson
Market index trading on a daily basis.
PRINT THIS ARTICLE
SUPPORT & RESISTANCE
The Buyers And Sellers
07/20/00 12:39:44 PMby Dennis D. Peterson
The rise and fall of equity prices can be seen as a battle between buyers and sellers that can reveal information on supply and demand.
Position: N/A
| Say you enter a long position with the intention of making a profit. If, however, prices move in the opposite direction, then you along with many other buyers, may decide to hold on to your positions hoping to profit at some future date. This can cause "overhead" resistance [1] [2], which can delay the breakout of your equity. |
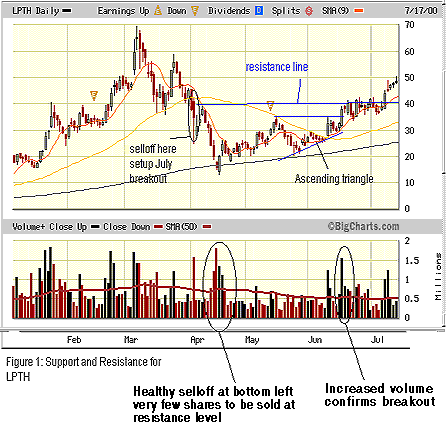
| The price chart below of Lightpath Technologies, Inc. [LPTH] illustrates the action between buyers and sellers. The on-balance volume (OBV) and volume are displayed on the lower panel since both are important when analyzing buying and selling activity. During the first week of April 2000, the stock experienced heavy selling volume, as it did again in mid-April. During those sell-offs it was only natural to expect the OBV to approach zero (or neutral with no increase or decrease in volume), which as you can see from the chart, is exactly what took place. It wasn't until the middle of June that the OBV showed signs of entering into positive territory. On the chart of LPTH you can see that in late June, prices churned around this resistance zone til the final breakout above $40.00 in July. |

|
| Graphic provided by: www.bigcharts.c. |
| |
| Applying this analysis to the investors, suppose they had entered long positions at around $40.00 in LPTH prior to the sell-off in April. Not everyone would have exited their long positions when they noticed prices falling. Additionally, some would have entered long positions during a pullback at approximately $36.00. These investors would be anxious to sell their holdings either to break even or make a small profit, which would mean that once prices hit a resistance zone between $36.00 and $40.00 you would expect to see their additional "overhead" supply of shares for sale. This would cause prices to stall in this area as the excess shares are sold off, then later the price would begin to rise again. |
| [1] Narcouzi, Christopher [2000]. "The Strength Of Support And Resistance." Technical Analysis of STOCKS & COMMODITIES, July [2] Edwards, Robert D. and John Magee [1997]. Technical Analysis of Stock Trends, 7th ed., AMACON. |
Market index trading on a daily basis.
| Title: | Staff Writer |
| Company: | Technical Analysis, Inc. |
| Address: | 4757 California Ave SW |
| Seattle, WA 98116-4499 | |
| Phone # for sales: | 206 938 0570 |
| Fax: | 206 938 1307 |
| Website: | www.traders.com |
| E-mail address: | dpeterson@traders.com |
Traders' Resource Links | |
| Charting the Stock Market: The Wyckoff Method -- Books | |
| Working-Money.com -- Online Trading Services | |
| Traders.com Advantage -- Online Trading Services | |
| Technical Analysis of Stocks & Commodities -- Publications and Newsletters | |
| Working Money, at Working-Money.com -- Publications and Newsletters | |
| Traders.com Advantage -- Publications and Newsletters | |
| Professional Traders Starter Kit -- Software | |
Click here for more information about our publications!
Comments

|

Request Information From Our Sponsors
- StockCharts.com, Inc.
- Candle Patterns
- Candlestick Charting Explained
- Intermarket Technical Analysis
- John Murphy on Chart Analysis
- John Murphy's Chart Pattern Recognition
- John Murphy's Market Message
- MurphyExplainsMarketAnalysis-Intermarket Analysis
- MurphyExplainsMarketAnalysis-Visual Analysis
- StockCharts.com
- Technical Analysis of the Financial Markets
- The Visual Investor
- VectorVest, Inc.
- Executive Premier Workshop
- One-Day Options Course
- OptionsPro
- Retirement Income Workshop
- Sure-Fire Trading Systems (VectorVest, Inc.)
- Trading as a Business Workshop
- VectorVest 7 EOD
- VectorVest 7 RealTime/IntraDay
- VectorVest AutoTester
- VectorVest Educational Services
- VectorVest OnLine
- VectorVest Options Analyzer
- VectorVest ProGraphics v6.0
- VectorVest ProTrader 7
- VectorVest RealTime Derby Tool
- VectorVest Simulator
- VectorVest Variator
- VectorVest Watchdog
