HOT TOPICS LIST
- MACD
- Fibonacci
- RSI
- Gann
- ADXR
- Stochastics
- Volume
- Triangles
- Futures
- Cycles
- Volatility
- ZIGZAG
- MESA
- Retracement
- Aroon
INDICATORS LIST
LIST OF TOPICS
PRINT THIS ARTICLE
by Gary Grosschadl
During the last great bubble of 2000, this was a $40 stock... now it's spent considerable time below $5. However, things are looking perkier now as the stock is coming off a two year low.
Position: Buy
Gary Grosschadl
Independent Canadian equities trader and technical analyst based in Peterborough
Ontario, Canada.
PRINT THIS ARTICLE
SYMMETRICAL TRIANGLE
The Bell May Be Ringing For Cincinnati Bell
07/07/05 02:14:05 PMby Gary Grosschadl
During the last great bubble of 2000, this was a $40 stock... now it's spent considerable time below $5. However, things are looking perkier now as the stock is coming off a two year low.
Position: Buy
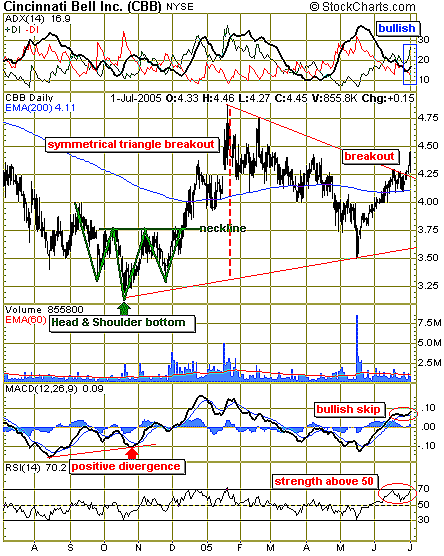
| This daily chart of Cincinnati Bell, Inc. shows the two year low was marked by a head and shoulders bottom. Valid bottoms are subsequently marked by a series of higher highs and higher lows (rising trend). The first higher low has registered recently with a quick stab down to $3.50. This allows a large symmetrical triangle formation which has recently broken to the upside. |
| Symmetrical triangles are deemed to be a neutral pattern until they break out in either direction. As with most patterns, a convincing move is usually accompanied with a larger volume spike. In this case, it is a little suspect as convincing volume has not materialized. It's a good time to consider other indicators to weigh the evidence. |

|
| A triangle breakout with an eventual upside target ($5.75) of the widest part of the formation as applied to the breakout point. |
| Graphic provided by: StockCharts.com. |
| |
| At the top of the chart, the directional movement indicator (a Welles Wilder creation) shows a bullish setup ocurring. Note the DI crossover back in June, giving the bulls the upper hand and a rising ADX hinting at growing trend strength. The ideal is an ADX level rising above 20, and this scenario is not far off. The two lower indicators are also showing bullish promise. The moving average convergence/divergence (MACD) indicator shows strength above the 0 line and what I call a "bullish skip" — a positive turn above the 0 line. Note the excellent signal given by the positive divergence on this indicator coinciding with the previous head and shoulders bottom. The relative strength index (RSI), another tool by Welles Wilder, introduced in his 1978 book, New Concepts In Technical Trading Systems, is a popular momentum oscillator. The RSI compares the magnitude of a stock's recent gains to the magnitude of its recent losses and turns that information into a number that ranges from 0 to 100. Here, we see strength above the 50 level, which bodes well for the bulls. |
| Although this is an encouraging pattern, the lack of volume is somewhat of a concern. This may lead to a future test of the upper trendline; success could then evolve into a stronger and safer trading signal. For now, it remains bullish unless the stock moves back inside the triangle. |
Independent Canadian equities trader and technical analyst based in Peterborough
Ontario, Canada.
| Website: | www.whatsonsale.ca/financial.html |
| E-mail address: | gwg7@sympatico.ca |
Click here for more information about our publications!
Comments
Date: 07/07/05Rank: 5Comment:

Request Information From Our Sponsors
- StockCharts.com, Inc.
- Candle Patterns
- Candlestick Charting Explained
- Intermarket Technical Analysis
- John Murphy on Chart Analysis
- John Murphy's Chart Pattern Recognition
- John Murphy's Market Message
- MurphyExplainsMarketAnalysis-Intermarket Analysis
- MurphyExplainsMarketAnalysis-Visual Analysis
- StockCharts.com
- Technical Analysis of the Financial Markets
- The Visual Investor
- VectorVest, Inc.
- Executive Premier Workshop
- One-Day Options Course
- OptionsPro
- Retirement Income Workshop
- Sure-Fire Trading Systems (VectorVest, Inc.)
- Trading as a Business Workshop
- VectorVest 7 EOD
- VectorVest 7 RealTime/IntraDay
- VectorVest AutoTester
- VectorVest Educational Services
- VectorVest OnLine
- VectorVest Options Analyzer
- VectorVest ProGraphics v6.0
- VectorVest ProTrader 7
- VectorVest RealTime Derby Tool
- VectorVest Simulator
- VectorVest Variator
- VectorVest Watchdog
