HOT TOPICS LIST
- MACD
- Fibonacci
- RSI
- Gann
- ADXR
- Stochastics
- Volume
- Triangles
- Futures
- Cycles
- Volatility
- ZIGZAG
- MESA
- Retracement
- Aroon
INDICATORS LIST
LIST OF TOPICS
PRINT THIS ARTICLE
by Koos van der Merwe
Pharmaceutical companies are not the most popular investment vehicles today, so why are insiders accumulating this one?
Position: Accumulate
Koos van der Merwe
Has been a technical analyst since 1969, and has worked as a futures and options trader with First Financial Futures in Johannesburg, South Africa.
PRINT THIS ARTICLE
FLAGS AND PENNANTS
SciClone Pharmaceuticals
07/11/05 01:25:28 PMby Koos van der Merwe
Pharmaceutical companies are not the most popular investment vehicles today, so why are insiders accumulating this one?
Position: Accumulate
| With many of the major pharmaceutical companies removing products from the market as evidence of deadly side effects have surfaced, investors have tended to move away from pharmaceutical investments. Yet here is a company whose share price rose dramatically from $2.10 to $5.18 without any major news announcement. The company manufactures a drug called ZADAXIN, which is used for hepatitis C nonresponder patients. From the way the price strengthened, pilot trials were apparently successful, and those investors watching the company had a field day as the price moved up dramatically. But what about in the future? |

|
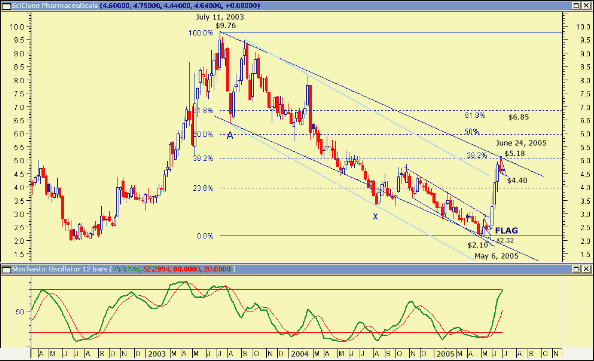
| SciClone Pharmaceuticals Weekly Chart |
| Graphic provided by: MetaStock. |
| |
| Looking at a weekly chart of SCLN, we can see the following: The price topped out at $9.76 on July 11, 2003. From that date it fell to a low of $2.10 on May 6, 2005. The share price then rose dramatically to a high of $5.18 on June 24, 2005, when it found resistance at the 38.2% Fibonocci retracement level of the high, $5.18, to the low, $2.10. Note that the resistance at $5.18 is also the level of the upper trendline drawn parallel to the support trendline. Purists could argue that the support line A-X is the correct line, with its corresponding parallel resistance line shown in light blue. However, this is a moot point to my reasoning, and I have drawn the support line (dark blue) to the greater number of lows reached. I prefer to look at the move of a given number of points below the support level as overenthusiasm in selling the share. This should translate into overenthusiasm in buying the share, and we should see a corresponding move above the upper resistance trendline with a fall back to turn it into a support level. Note that the RSI (relative strength index) has not broken above the 70 level, suggesting there is still some upside potential. |

|
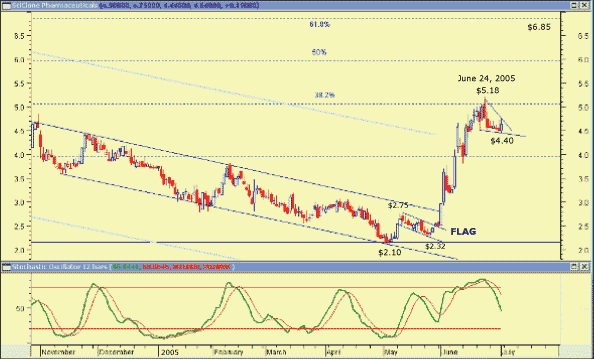
| SciClone Pharmaceuticals Daily Chart |
| Graphic provided by: MetaStock. |
| |
| When we examine a daily chart of SCLN, we can see the following: From the low of $2.10, the share price rose to $2.75 and formed a flag pattern, breaking out strongly with two corrections to reach the high of $5.18 on June 23, 2005. The stochastic oscillator gave a sell signal as the price fell in what at the moment looks like a triangular pattern. However, this pattern could well turn into another flag, should the price fall farther. When and if the price breaks out of the flag, the target could be the 50% Fibonocci retracement level of $6.00, or even the 61.8% Fibonocci level of $6.85. |

|
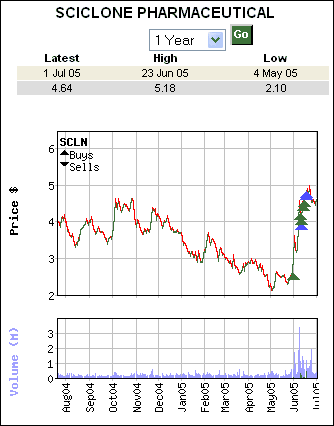
| SciClone Pharmaceuticals Insider Trading |
| Graphic provided by: FindLaw Financial. |
| |
| Finally, here's a chart produced by FindLaw Financial (http://partners.thomsonfn.com/FindLaw/stockquote), which shows that insiders have been accumulating the share. |
| SCLN could be placed on your watch list and purchased should it break above $5.18. |
Has been a technical analyst since 1969, and has worked as a futures and options trader with First Financial Futures in Johannesburg, South Africa.
| Address: | 3256 West 24th Ave |
| Vancouver, BC | |
| Phone # for sales: | 6042634214 |
| E-mail address: | petroosp@gmail.com |
Click here for more information about our publications!
Comments
Date: 07/11/05Rank: 4Comment:

Request Information From Our Sponsors
- StockCharts.com, Inc.
- Candle Patterns
- Candlestick Charting Explained
- Intermarket Technical Analysis
- John Murphy on Chart Analysis
- John Murphy's Chart Pattern Recognition
- John Murphy's Market Message
- MurphyExplainsMarketAnalysis-Intermarket Analysis
- MurphyExplainsMarketAnalysis-Visual Analysis
- StockCharts.com
- Technical Analysis of the Financial Markets
- The Visual Investor
- VectorVest, Inc.
- Executive Premier Workshop
- One-Day Options Course
- OptionsPro
- Retirement Income Workshop
- Sure-Fire Trading Systems (VectorVest, Inc.)
- Trading as a Business Workshop
- VectorVest 7 EOD
- VectorVest 7 RealTime/IntraDay
- VectorVest AutoTester
- VectorVest Educational Services
- VectorVest OnLine
- VectorVest Options Analyzer
- VectorVest ProGraphics v6.0
- VectorVest ProTrader 7
- VectorVest RealTime Derby Tool
- VectorVest Simulator
- VectorVest Variator
- VectorVest Watchdog
