HOT TOPICS LIST
- MACD
- Fibonacci
- RSI
- Gann
- ADXR
- Stochastics
- Volume
- Triangles
- Futures
- Cycles
- Volatility
- ZIGZAG
- MESA
- Retracement
- Aroon
INDICATORS LIST
LIST OF TOPICS
PRINT THIS ARTICLE
by David Penn
Are gold bugs mis-reading EWT in order to arrive at a bullish outlook for gold?
Position: N/A
David Penn
Technical Writer for Technical Analysis of STOCKS & COMMODITIES magazine, Working-Money.com, and Traders.com Advantage.
PRINT THIS ARTICLE
ELLIOTT WAVE
The New Gold Bull Market?
07/07/05 11:31:09 AMby David Penn
Are gold bugs mis-reading EWT in order to arrive at a bullish outlook for gold?
Position: N/A
| There is an Elliott wave count currently making the rounds of the gold bugs that I fear might be flawed. That this count comes from an analyst whose work I respect might be troubling if it weren't for the fact that this analyst — who admits to being far from an expert in Elliott wave methodology — gives due respect to the "deflation side" of the great, post-dot.com bubble "inflation/deflation" debate. As such, I can't help but feel as if his relatively bullish, EWT-inspired take on gold it really just an attempt to give some due to those who hold a macro argument of which he is not entirely convinced. |
| That said, it is no secret that most Elliotticians remain decidedly bearish on gold. And the combination of that bearish outlook and the wave count circulating among some gold bugs might be especially confusing to those who embrace much of what the Elliotticians have had to say about contemporary finance, but remain wedded to the notion of a secular bull market in gold rather than a cyclical one. |

|
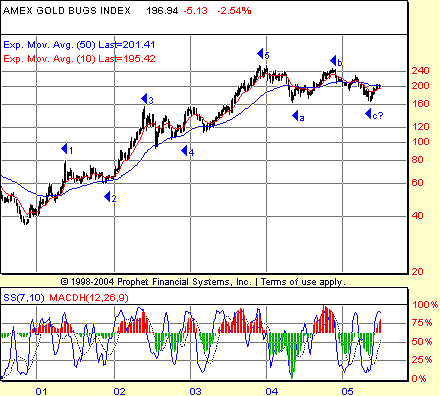
| One popular Elliott wave count of the $HUI that is making the rounds could provide gold bugs with hope they can ill afford. |
| Graphic provided by: Prophet Financial, Inc. |
| |
| My technical quarrel with the above wave count is that it posits that the $HUI, or the index of unhedged gold stocks, has completed not only a five-wave advance, but also has completed a three-wave correction. Were this to be the case, then gold bugs would be more than justified in their belief/hope that gold, or at least the lower-priced gold mining shares that make up the $HUI, were headed significantly higher in the near term. |
| However, I do not believe this to be the case. And the wave count shown above serves as evidence. The count in Figure 1 has the end of the A-B-C correction bottoming around 175. However, completed A-B-C corrections need to retrace into the territory of the fourth wave of the preceding five-wave advance before being considered complete. This would require the third leg of the correction, the "c" leg, to fall much further than where those supporting the above EW count are suggesting that it has already ended. That "further" would be in the neighborhood of 100, where the above count suggests that the five-wave advance's fourth wave put in its fourth-wave low. |
| There is another reason to question the bullishness of the $HUI at this point. Note the depth of the MACDH extreme during the "a" leg of the correction. As I have written here and in Working Money, the lows registered during MACDH extreme troughs must be exceeded or "confirmed." That confirmation may come in the same decline. Other times, a significant bounce might develop in between the current decline and the next one--the "next one" being the decline that will see the lows during the MACDH extreme trough violated. But the absolute low price on a decline rarely occurs simultaneously with the absolute low in the MACDH. Thus, the MACDH also seems to suggest that the correction in the $HUI is not concluded. Given the gold bug's wave count in Figure 1, a retreat to the 100 level, it seems to me, is more likely in the near-term than a vault to 300. |
Technical Writer for Technical Analysis of STOCKS & COMMODITIES magazine, Working-Money.com, and Traders.com Advantage.
| Title: | Technical Writer |
| Company: | Technical Analysis, Inc. |
| Address: | 4757 California Avenue SW |
| Seattle, WA 98116 | |
| Phone # for sales: | 206 938 0570 |
| Fax: | 206 938 1307 |
| Website: | www.Traders.com |
| E-mail address: | DPenn@traders.com |
Traders' Resource Links | |
| Charting the Stock Market: The Wyckoff Method -- Books | |
| Working-Money.com -- Online Trading Services | |
| Traders.com Advantage -- Online Trading Services | |
| Technical Analysis of Stocks & Commodities -- Publications and Newsletters | |
| Working Money, at Working-Money.com -- Publications and Newsletters | |
| Traders.com Advantage -- Publications and Newsletters | |
| Professional Traders Starter Kit -- Software | |
Click here for more information about our publications!
Comments
Date: 07/07/05Rank: 3Comment:
Date: 07/07/05Rank: 5Comment:
Date: 07/14/05Rank: 5Comment:

Request Information From Our Sponsors
- VectorVest, Inc.
- Executive Premier Workshop
- One-Day Options Course
- OptionsPro
- Retirement Income Workshop
- Sure-Fire Trading Systems (VectorVest, Inc.)
- Trading as a Business Workshop
- VectorVest 7 EOD
- VectorVest 7 RealTime/IntraDay
- VectorVest AutoTester
- VectorVest Educational Services
- VectorVest OnLine
- VectorVest Options Analyzer
- VectorVest ProGraphics v6.0
- VectorVest ProTrader 7
- VectorVest RealTime Derby Tool
- VectorVest Simulator
- VectorVest Variator
- VectorVest Watchdog
- StockCharts.com, Inc.
- Candle Patterns
- Candlestick Charting Explained
- Intermarket Technical Analysis
- John Murphy on Chart Analysis
- John Murphy's Chart Pattern Recognition
- John Murphy's Market Message
- MurphyExplainsMarketAnalysis-Intermarket Analysis
- MurphyExplainsMarketAnalysis-Visual Analysis
- StockCharts.com
- Technical Analysis of the Financial Markets
- The Visual Investor
