HOT TOPICS LIST
- MACD
- Fibonacci
- RSI
- Gann
- ADXR
- Stochastics
- Volume
- Triangles
- Futures
- Cycles
- Volatility
- ZIGZAG
- MESA
- Retracement
- Aroon
INDICATORS LIST
LIST OF TOPICS
PRINT THIS ARTICLE
by David Penn
In the words of Jesse Livermore: "Never too low to sell, never too high to buy."
Position: N/A
David Penn
Technical Writer for Technical Analysis of STOCKS & COMMODITIES magazine, Working-Money.com, and Traders.com Advantage.
PRINT THIS ARTICLE
TRIANGLES
The Dollar's Ascending Triangle Breakout
07/01/05 03:53:18 PMby David Penn
In the words of Jesse Livermore: "Never too low to sell, never too high to buy."
Position: N/A
| I remember a Market Wizard opining that he'd hate to be on the other side of the trade with certain traders. And while that makes a great deal of sense, there is a kind of comfort that comes with betting against wizards and super geniuses: if you're wrong and they're right, at least you know exactly why. I've been a long-time bull on the US dollar--as anyone who has read my articles in Working Money and Traders.com Advantage can attest. So recent remarks by some traders and technical analysts, whose work I highly respect, that suggested gold was about to spike and the dollar to plunge sent shivers down my spine. |
| Helpfully, the great thing about technical analysis is that we can each of us do our own homework and come to our own conclusions. No special economic talent needed. No connections with corporate insiders. Just the charts, Ma'am. |

|
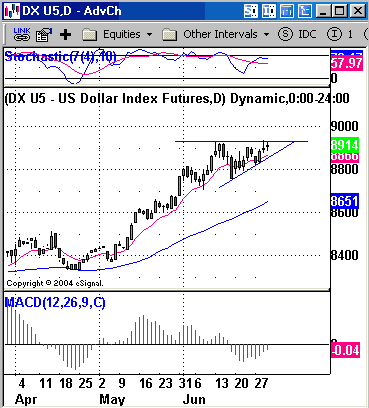
| The 10-day exponential moving average (in red) provides support as the ascending triangle consolidation edges higher. |
| Graphic provided by: eSignal. |
| |
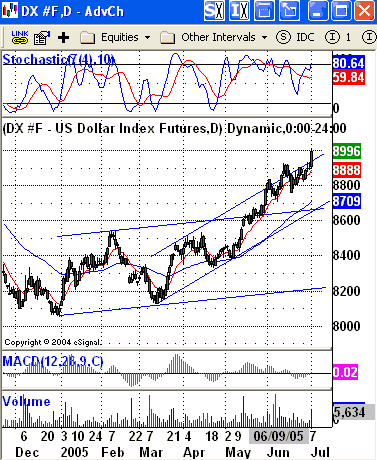
| And what the charts reminded me was that the dollar is getting stronger. As I wrote over a month ago ("Channeling The Dollar," Traders.com Advantage, May 19, 2005), it would be important to see how the dollar reacted once it left its initial trend channel and entered into a second, more advanced and more steeped trend channel. If a market is strong, then once it enters that second trend channel, it will not retreat back into the previous, initial trend channel. |

|
| After breaking free from its original trend channel, the dollar moves higher, testing and breaking through the upper boundary of its second, more aggressive trend channel. |
| Graphic provided by: eSignal. |
| |
| Weak markets, on the other hand, tend not to be able to sustain the angle of ascent suggested by the secondary channel. Moreover, after breaking down from these secondary channels, weak markets often aren't able to find support in the old channel that was left behind. Examples of weak markets that have or are breaking from their trend channels include the S&P 500 and other major stock indices since the April lows (and the June highs). Another example of this kind of weakness can be found in a chart of the EURUSD (see my article "The Euro Channel," Traders.com Advantage, June 9, 2005). The US dollar, on the other hand, has been a textbook example of a strong market--at least as far as the channel analysis is concerned. The greenback's original trend channel stretches back to the bottom in late December 2004. The secondary, more aggressive trend channel has its origins in the March 2005 lows. When the greenback broke above the upper boundary of the original trend channel in mid-to-late May, it entered a critical phase. Would the greenback, during its inevitable pullback, find support on the back of the old trend channel--thus revealing strength? Or would it collapse back into the channel, potentially anticipating future weakness that would end the months-long rally? The price action in recent days--especially on July 1--argued strongly for the former, if that. In fact, the "inevitable pullback" I just described appeared to have been accomplished instead by way of an ascending triangle consolidation. And that ascending triangle consolidation has been resolved by way of a powerful breakout to the upside. |

|
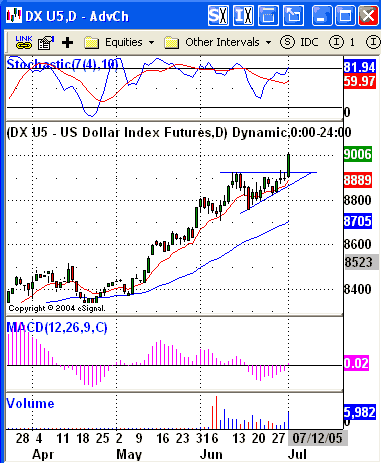
| The breakout from this ascending triangle is accompanied by strong volume. |
| Graphic provided by: eSignal. |
| |
| Breakouts from triangles tend to produce the sort of powerful moves seen in Figure 2. In a sense, a triangle is a picture-perfect example of volatility shrinking below typical levels as price ranges grow smaller and smaller. And like a coiled spring, when the pressure is finally released, the reaction can seem outsized and exaggerated. But this is only the effort of prices to return to a more typical (or historic) volatility. "Too little" volatility in the triangle combined with "too much" volatility on the breakout is, like the volatility of the weather, just nature's way of maintaining a sustainable balance. What sort of upside does the ascending triangle in the US dollar anticipate? With a formation high of 89.23 (basis December futures) and a formation low of 87.54, a minimum upside of 1.69 to the 91 area seems like a likely destination (90.92 to be specific). After that, who knows? There are too many who didn't think the dollar would make it this far. |
Technical Writer for Technical Analysis of STOCKS & COMMODITIES magazine, Working-Money.com, and Traders.com Advantage.
| Title: | Technical Writer |
| Company: | Technical Analysis, Inc. |
| Address: | 4757 California Avenue SW |
| Seattle, WA 98116 | |
| Phone # for sales: | 206 938 0570 |
| Fax: | 206 938 1307 |
| Website: | www.Traders.com |
| E-mail address: | DPenn@traders.com |
Traders' Resource Links | |
| Charting the Stock Market: The Wyckoff Method -- Books | |
| Working-Money.com -- Online Trading Services | |
| Traders.com Advantage -- Online Trading Services | |
| Technical Analysis of Stocks & Commodities -- Publications and Newsletters | |
| Working Money, at Working-Money.com -- Publications and Newsletters | |
| Traders.com Advantage -- Publications and Newsletters | |
| Professional Traders Starter Kit -- Software | |
Click here for more information about our publications!
Comments
Date: 07/01/05Rank: 4Comment:
Date: 07/05/05Rank: 5Comment:

Request Information From Our Sponsors
- VectorVest, Inc.
- Executive Premier Workshop
- One-Day Options Course
- OptionsPro
- Retirement Income Workshop
- Sure-Fire Trading Systems (VectorVest, Inc.)
- Trading as a Business Workshop
- VectorVest 7 EOD
- VectorVest 7 RealTime/IntraDay
- VectorVest AutoTester
- VectorVest Educational Services
- VectorVest OnLine
- VectorVest Options Analyzer
- VectorVest ProGraphics v6.0
- VectorVest ProTrader 7
- VectorVest RealTime Derby Tool
- VectorVest Simulator
- VectorVest Variator
- VectorVest Watchdog
- StockCharts.com, Inc.
- Candle Patterns
- Candlestick Charting Explained
- Intermarket Technical Analysis
- John Murphy on Chart Analysis
- John Murphy's Chart Pattern Recognition
- John Murphy's Market Message
- MurphyExplainsMarketAnalysis-Intermarket Analysis
- MurphyExplainsMarketAnalysis-Visual Analysis
- StockCharts.com
- Technical Analysis of the Financial Markets
- The Visual Investor
