HOT TOPICS LIST
- MACD
- Fibonacci
- RSI
- Gann
- ADXR
- Stochastics
- Volume
- Triangles
- Futures
- Cycles
- Volatility
- ZIGZAG
- MESA
- Retracement
- Aroon
INDICATORS LIST
LIST OF TOPICS
PRINT THIS ARTICLE
by Paolo Pezzutti
The Dow Jones Industrial Average gets closer to support levels as negative news affects investor attitudes.
Position: N/A
Paolo Pezzutti
Author of the book "Trading the US Markets - A Comprehensive Guide to US Markets for International Traders and Investors" - Harriman House (July 2008)
PRINT THIS ARTICLE
DOW THEORY
Dow Mini: Retest Of Support Likely
07/14/05 12:45:45 PMby Paolo Pezzutti
The Dow Jones Industrial Average gets closer to support levels as negative news affects investor attitudes.
Position: N/A
| The 10-year interest rates are very close to their all-time highs. Some time ago, Fed Chairman Alan Greenspan reported a "conundrum" in rates. At the same time, oil prices rose above $60 last week; press reports stress the possible impact of high oil prices on global economic growth; and Europe's economy continues to be sluggish. On the other hand, the Asian (especially Chinese) and US economies are growing rapidly with little or no sign--so far--of a significant slowdown. What's wrong with this picture? Is someone making a mistake evaluating market forces? Is the bond market expecting a slowdown that will never happen? Are oil prices justified on the basis of continued growth and demand expectations? It's difficult to say, of course. In the final two trading sessions last week, stock prices went down quickly, printing wide-range days on a record high in oil prices. Markets fear that higher energy costs will eventually have an impact on corporate profits. Yesterday, the Federal Open Market Committee ordered another quarter-point rate hike for the ninth consecutive time and signaled more increases ahead. In reaction, the Dow Jones Industrial Average (DJIA) lost 99 points. The rate hike itself was not a surprise, as there were strong hints that the central bank would increase rates again. And more rate hikes are likely, even though some hoped that the Fed would communicate an end to the tightening cycle. The Fed statement noted productivity and robust underlying growth in the economy, and referred to rising inflation pressure, but said that pressure remains well-contained. Let's analyze the DJIA's technical situation to see if we can find a catalyst for prices to start a new downtrend. |

|
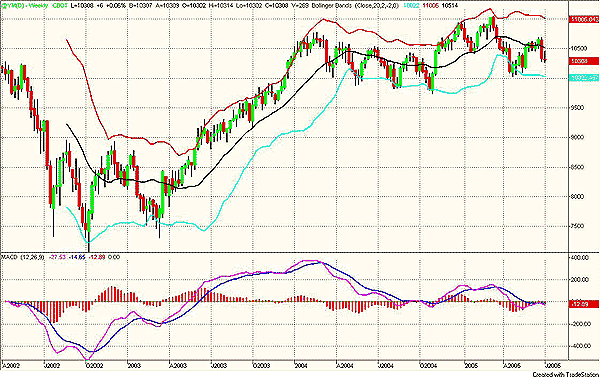
| Figure 1. The weekly chart of the mini-sized Dow futures contract displays the trading range market conditions that started at the beginning of 2004. |
| Graphic provided by: TradeStation. |
| |
| In Figure 1, you can see a weekly chart of the Dow mini futures contract. After the DJIA printed a low in the 7500 area in October 2002, it started an uptrend that brought prices to a relative high at 10700 in the first months of 2004. From that moment on, a trading range developed between about 9800 and 11000, and that is still continuing. Note that the MACD reached its high at the beginning of 2004. Later, it printed a significant negative divergence when prices made a failure test of the previous highs at the beginning of 2005. Bollinger Bands are flat and parallel, indicating a typical trading range environment. In the last week of June 2005, prices printed a wide-range down bar. The technical situation has not changed in this time frame so far, but it might be the first alert that something has altered investors' attitudes. Bad news is now having a negative impact on prices. |

|
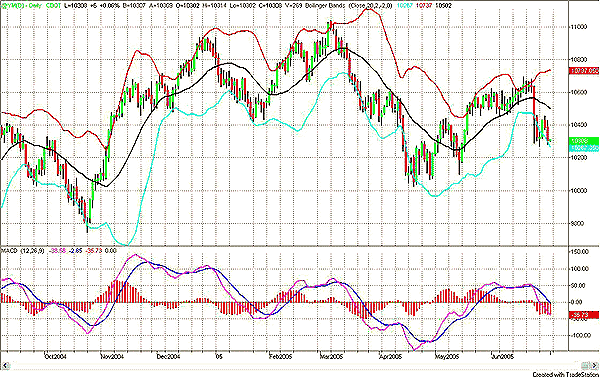
| Figure 2. The daily chart shows the impulse to the downside, printed in the final week of June. |
| Graphic provided by: TradeStation. |
| |
| In Figure 2, the daily chart confirms the trading range environment that already emerged at the weekly level. Note the MACD negative divergence in March 2005 when prices reached new highs above 11000. Prices then developed an ABC move down to about 10000, with MACD displaying a downward impulse. During the course of five weeks, prices lost about 1,000 points. In the following two months, from April to June 2005, prices recovered only about 600 points before printing the two down wide-range bars of the last week. This is not a positive sign regarding the market's strength and ability to move again to retest previous highs. MACD is now negatively oriented, and Bollinger Bands are opening with prices well below the lower band, representing an impulse to the downside. |
| In summary, prices in the medium term are still in a trading range, and recent negative sessions have still not negatively affected the market picture. In the short term, indications are for lower prices. Unless prices recover very quickly, I would expect a retest of previous lows at the 9800 to 10000 level. It is too early to say that a new downtrend is ahead. In fact, given the current bond behavior, we should not expect a significant change in the stock market's condition. However, the impulse printed is significant, as far as it indicates a change in investors' moods. It is important to observe how the DJIA will react when support levels are retested. |
Author of the book "Trading the US Markets - A Comprehensive Guide to US Markets for International Traders and Investors" - Harriman House (July 2008)
| Address: | VIA ROBERTO AGO 26 POSTAL CODE 00166 |
| Rome, ITALY | |
| Phone # for sales: | +393357540708 |
| E-mail address: | pezzutti.paolo@tiscali.it |
Click here for more information about our publications!
Comments
Date: 07/15/05Rank: 4Comment:

Request Information From Our Sponsors
- VectorVest, Inc.
- Executive Premier Workshop
- One-Day Options Course
- OptionsPro
- Retirement Income Workshop
- Sure-Fire Trading Systems (VectorVest, Inc.)
- Trading as a Business Workshop
- VectorVest 7 EOD
- VectorVest 7 RealTime/IntraDay
- VectorVest AutoTester
- VectorVest Educational Services
- VectorVest OnLine
- VectorVest Options Analyzer
- VectorVest ProGraphics v6.0
- VectorVest ProTrader 7
- VectorVest RealTime Derby Tool
- VectorVest Simulator
- VectorVest Variator
- VectorVest Watchdog
- StockCharts.com, Inc.
- Candle Patterns
- Candlestick Charting Explained
- Intermarket Technical Analysis
- John Murphy on Chart Analysis
- John Murphy's Chart Pattern Recognition
- John Murphy's Market Message
- MurphyExplainsMarketAnalysis-Intermarket Analysis
- MurphyExplainsMarketAnalysis-Visual Analysis
- StockCharts.com
- Technical Analysis of the Financial Markets
- The Visual Investor
