HOT TOPICS LIST
- MACD
- Fibonacci
- RSI
- Gann
- ADXR
- Stochastics
- Volume
- Triangles
- Futures
- Cycles
- Volatility
- ZIGZAG
- MESA
- Retracement
- Aroon
INDICATORS LIST
LIST OF TOPICS
PRINT THIS ARTICLE
by Arthur Hill
The British Pound Index ($XBP) broke key support in May and looks set to continue lower after a flat consolidation.
Position: Sell
Arthur Hill
Arthur Hill is currently editor of TDTrader.com, a website specializing in trading strategies, sector/industry specific breadth stats and overall technical analysis. He passed the Society of Technical Analysts (STA London) diploma exam with distinction is a Certified Financial Technician (CFTe). Prior to TD Trader, he was the Chief Technical Analyst for Stockcharts.com and the main contributor to the ChartSchool.
PRINT THIS ARTICLE
DESCENDING TRIANGLES
British Pound Index Breaks Down Further
07/07/05 11:42:06 AMby Arthur Hill
The British Pound Index ($XBP) broke key support in May and looks set to continue lower after a flat consolidation.
Position: Sell
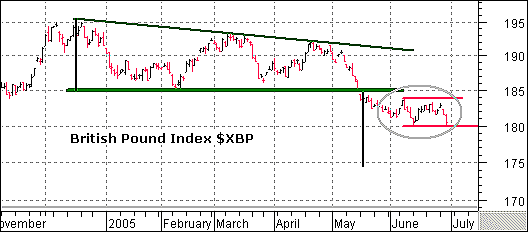
| On the daily chart, $XBP formed a descending triangle from January to April and broke support in mid May. These are usually bearish continuation patterns, but can also mark important tops. The lower highs show that buyers are unable to push prices past the prior high and selling pressure is setting in at lower and lower levels. The equal lows (~185) represent the demand line. Supply won a victory over demand with the break below 185, and the downside target is around 175 (195 - 185 = 10, 185 - 10 = 175). |

|
| Graphic provided by: MetaStock. |
| Graphic provided by: Reuters Data. |
| |
| Since breaking descending triangle support, a consolidation formed around 180-184 (gray oval). Broken support turned into resistance and the index was unable to make it back above 185. With the prior move down, this flat consolidation favors a continuation lower. A move below 180 would trigger that move and open the door to 175 or lower. |

|
| Graphic provided by: MetaStock. |
| Graphic provided by: Reuters Data. |
| |
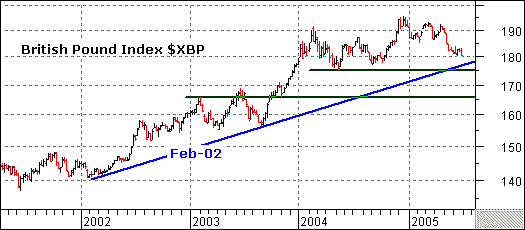
| The weekly chart can provide some perspective and help identify the next support areas. The index remains above the trendline extending up from February 2002. This trendline and the 2004 lows mark support around 175-178. The next support area is around 165, and this is marked by broken resistance from the 2003 highs. I estimate that the index will find support somewhere in between or around 170. The bearish patterns mentioned above favor further downside and 175 is unlikely to hold. |
Arthur Hill is currently editor of TDTrader.com, a website specializing in trading strategies, sector/industry specific breadth stats and overall technical analysis. He passed the Society of Technical Analysts (STA London) diploma exam with distinction is a Certified Financial Technician (CFTe). Prior to TD Trader, he was the Chief Technical Analyst for Stockcharts.com and the main contributor to the ChartSchool.
| Title: | Editor |
| Company: | TDTrader.com |
| Address: | Willem Geetsstraat 17 |
| Mechelen, B2800 | |
| Phone # for sales: | 3215345465 |
| Website: | www.tdtrader.com |
| E-mail address: | arthurh@tdtrader.com |
Traders' Resource Links | |
| TDTrader.com has not added any product or service information to TRADERS' RESOURCE. | |
Click here for more information about our publications!
Comments
Date: 07/07/05Rank: 4Comment:
Date: 07/07/05Rank: 5Comment:

Request Information From Our Sponsors
- StockCharts.com, Inc.
- Candle Patterns
- Candlestick Charting Explained
- Intermarket Technical Analysis
- John Murphy on Chart Analysis
- John Murphy's Chart Pattern Recognition
- John Murphy's Market Message
- MurphyExplainsMarketAnalysis-Intermarket Analysis
- MurphyExplainsMarketAnalysis-Visual Analysis
- StockCharts.com
- Technical Analysis of the Financial Markets
- The Visual Investor
- VectorVest, Inc.
- Executive Premier Workshop
- One-Day Options Course
- OptionsPro
- Retirement Income Workshop
- Sure-Fire Trading Systems (VectorVest, Inc.)
- Trading as a Business Workshop
- VectorVest 7 EOD
- VectorVest 7 RealTime/IntraDay
- VectorVest AutoTester
- VectorVest Educational Services
- VectorVest OnLine
- VectorVest Options Analyzer
- VectorVest ProGraphics v6.0
- VectorVest ProTrader 7
- VectorVest RealTime Derby Tool
- VectorVest Simulator
- VectorVest Variator
- VectorVest Watchdog
