HOT TOPICS LIST
- MACD
- Fibonacci
- RSI
- Gann
- ADXR
- Stochastics
- Volume
- Triangles
- Futures
- Cycles
- Volatility
- ZIGZAG
- MESA
- Retracement
- Aroon
INDICATORS LIST
LIST OF TOPICS
PRINT THIS ARTICLE
by Gary Grosschadl
Gas pump prices may reflect oil's latest run-up, but the oil index is finally showing some weakness. With a little cooperation from the markets, relief may be coming.
Position: Sell
Gary Grosschadl
Independent Canadian equities trader and technical analyst based in Peterborough
Ontario, Canada.
PRINT THIS ARTICLE
CHART ANALYSIS
Oil Index Ripe For Correction
07/07/05 02:37:50 PMby Gary Grosschadl
Gas pump prices may reflect oil's latest run-up, but the oil index is finally showing some weakness. With a little cooperation from the markets, relief may be coming.
Position: Sell
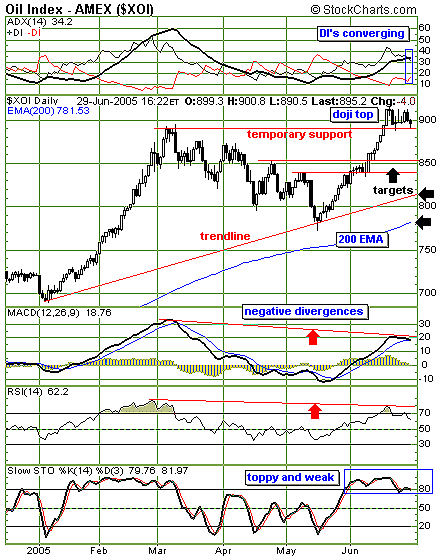
| With the price of oil hitting an all-time high of $60 a barrel, the oil index has also hit record highs above 900. Fortunately, this bull run is starting to look a little tired #8212; this chart suggests downside possibilities are more likely than a continued upside. |
| The index may be sitting on temporary support for several reasons. After an extended run, a doji candlestick at the top often signals that the bull is tired and bearish forces may be ready to take over. Since that small doji (in the shape of a small cross) marked the top, this move has started to drift sideways with initial support indicated at 890. |

|
| Daily chart of the oil index suggests a doji top may be in. |
| Graphic provided by: StockCharts.com. |
| |
| Several indicators reinforce this notion of a tired bull run. At the top of the chart, the directional indicators (DIs) have started to converge. The components of this directional movement indicator show a breakdown of the previous bullish configuration. When the ADX line is no longer in between the DIs, it reflects either an overheated ADX or an approaching DI reversal. In this case, it is the start of what could be an eventual DI reversal. Bearish power (-DI) is increasing while bullish power (+DI) is waning. |
| The lower indicators also show bearish promise. The moving average convergence/divergence (MACD) and the relative strength indicator (RSI) both show negative divergence to recent price action. As prices climbed to new highs, these indicators failed to follow suit, which very often points to a coming decline or downleg. Finally, the stochastic oscillator shows an overbought condition and a move under 80 just starting. This also points to a downleg developing. |
| Should the temporary support level fail at 890, three lower targets are suggested: a previous congestion zone 840 - 850, a trendline at 815, and finally, the 200 - day EMA, currently at 780. A surprise move above the doji high negates this bearish outlook and $70 oil may rear its ugly head. |
Independent Canadian equities trader and technical analyst based in Peterborough
Ontario, Canada.
| Website: | www.whatsonsale.ca/financial.html |
| E-mail address: | gwg7@sympatico.ca |
Click here for more information about our publications!
Comments
Date: 07/07/05Rank: 5Comment:

Request Information From Our Sponsors
- StockCharts.com, Inc.
- Candle Patterns
- Candlestick Charting Explained
- Intermarket Technical Analysis
- John Murphy on Chart Analysis
- John Murphy's Chart Pattern Recognition
- John Murphy's Market Message
- MurphyExplainsMarketAnalysis-Intermarket Analysis
- MurphyExplainsMarketAnalysis-Visual Analysis
- StockCharts.com
- Technical Analysis of the Financial Markets
- The Visual Investor
- VectorVest, Inc.
- Executive Premier Workshop
- One-Day Options Course
- OptionsPro
- Retirement Income Workshop
- Sure-Fire Trading Systems (VectorVest, Inc.)
- Trading as a Business Workshop
- VectorVest 7 EOD
- VectorVest 7 RealTime/IntraDay
- VectorVest AutoTester
- VectorVest Educational Services
- VectorVest OnLine
- VectorVest Options Analyzer
- VectorVest ProGraphics v6.0
- VectorVest ProTrader 7
- VectorVest RealTime Derby Tool
- VectorVest Simulator
- VectorVest Variator
- VectorVest Watchdog
