HOT TOPICS LIST
- MACD
- Fibonacci
- RSI
- Gann
- ADXR
- Stochastics
- Volume
- Triangles
- Futures
- Cycles
- Volatility
- ZIGZAG
- MESA
- Retracement
- Aroon
INDICATORS LIST
LIST OF TOPICS
PRINT THIS ARTICLE
by Gary Grosschadl
As this high-tech index attempts to challenge previous highs, it has fallen short or at least stalled. A "pitchfork" view aptly illustrates this.
Position: Hold
Gary Grosschadl
Independent Canadian equities trader and technical analyst based in Peterborough
Ontario, Canada.
PRINT THIS ARTICLE
ANDREWS PITCH-FORK
Nasdaq Being Tested
07/01/05 04:49:20 PMby Gary Grosschadl
As this high-tech index attempts to challenge previous highs, it has fallen short or at least stalled. A "pitchfork" view aptly illustrates this.
Position: Hold
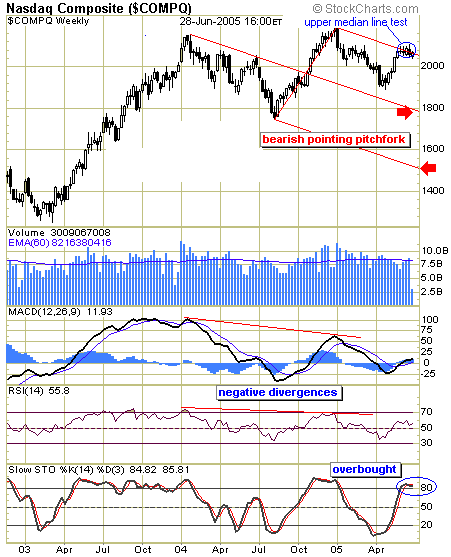
| The Andrews pitchfork charting method, which is named after Alan Andrews, is a line study consisting of three parallel trendlines based on three selected turning points. The interpretation of a pitchfork is based on normal trendline support and resistance principles. Prices tend to "walk along" the trendlines, bouncing between the "tines" of the fork until there is significant trend change. A significant trend change alters the nature of the fork from downward pointing (bearish) to upward pointing (bullish) or vice versa. |
| Currently, on this weekly chart, the Nasdaq is undergoing a test of the upper median line. This also relates to a previous congestion area looking back to early 2005. Should this test fail, then this index will likely make a move toward the center median line again. Until the upper median line is surpassed, this pitchfork keeps its bearish bias. Two downside targets are suggested, the first being the median line near 1800, and then the lower median line (near 1500) if extra bearishness develops. |

|
| On this weekly pitchfork chart, we see a bearish bias, unless the upper limit is surpassed. |
| Graphic provided by: StockCharts.com. |
| |
| The indicators below the chart are worthy of comment. The MACD (moving average convergence/divergence) and the RSI (relative strength index) both show the negative divergences that preceded the downleg that began in 2005. The stochastics oscillator shows an overbought condition, which has the potential of leading to another downleg. |
| The prudent call here is a hold until there is further evidence of the outcome of this upper median line test. A convincing move either up or down from here will light the path more clearly: either a shift to a bullish pitchfork (redraw lines with a sustained move above the upper line), or a move back down to test the lower limits. |
Independent Canadian equities trader and technical analyst based in Peterborough
Ontario, Canada.
| Website: | www.whatsonsale.ca/financial.html |
| E-mail address: | gwg7@sympatico.ca |
Click here for more information about our publications!
Comments
Date: 07/02/05Rank: 5Comment:
Date: 07/05/05Rank: 3Comment:
Date: 07/05/05Rank: 5Comment:
Date: 07/07/05Rank: 4Comment:

Request Information From Our Sponsors
- StockCharts.com, Inc.
- Candle Patterns
- Candlestick Charting Explained
- Intermarket Technical Analysis
- John Murphy on Chart Analysis
- John Murphy's Chart Pattern Recognition
- John Murphy's Market Message
- MurphyExplainsMarketAnalysis-Intermarket Analysis
- MurphyExplainsMarketAnalysis-Visual Analysis
- StockCharts.com
- Technical Analysis of the Financial Markets
- The Visual Investor
- VectorVest, Inc.
- Executive Premier Workshop
- One-Day Options Course
- OptionsPro
- Retirement Income Workshop
- Sure-Fire Trading Systems (VectorVest, Inc.)
- Trading as a Business Workshop
- VectorVest 7 EOD
- VectorVest 7 RealTime/IntraDay
- VectorVest AutoTester
- VectorVest Educational Services
- VectorVest OnLine
- VectorVest Options Analyzer
- VectorVest ProGraphics v6.0
- VectorVest ProTrader 7
- VectorVest RealTime Derby Tool
- VectorVest Simulator
- VectorVest Variator
- VectorVest Watchdog
