HOT TOPICS LIST
- MACD
- Fibonacci
- RSI
- Gann
- ADXR
- Stochastics
- Volume
- Triangles
- Futures
- Cycles
- Volatility
- ZIGZAG
- MESA
- Retracement
- Aroon
INDICATORS LIST
LIST OF TOPICS
PRINT THIS ARTICLE
by Gary Grosschadl
Since peaking in 2000, Walmart share prices have drifted sideways, but a pattern break has recently occurred.
Position: Sell
Gary Grosschadl
Independent Canadian equities trader and technical analyst based in Peterborough
Ontario, Canada.
PRINT THIS ARTICLE
SYMMETRICAL TRIANGLE
Walmart: Guaranteed Lower Prices?
07/01/05 04:19:08 PMby Gary Grosschadl
Since peaking in 2000, Walmart share prices have drifted sideways, but a pattern break has recently occurred.
Position: Sell
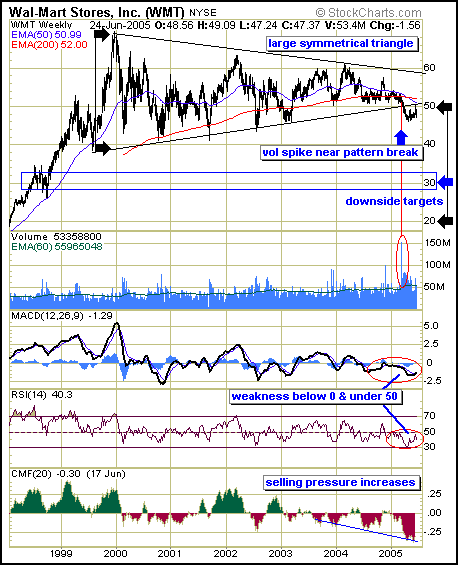
| This weekly chart shows a large symmetrical triangle that has broken to the downside and now may be testing that breakout point. These triangles are often considered to have a neutral bias until they break in either direction. They can also be considered continuation patterns, eventually moving in the direction of the previous trend. If this is to be a continuation pattern, since the previous trend was up, another upleg can be expected. However, the downside break hints otherwise. |
| Normally, when a pattern breaks, there should be a confirming surge in volume. In this case, there was a big volume spike, but it actually occurred two weeks before the breakdown, almost as if smart money anticipated the downside move. After a pattern break, there can be a retest of the breakdown point and this may be the case now. Should this test fail, expect another surge in volume as more traders anticipate further downside. |

|
| Long-term weekly chart of Walmart showing a pattern break. |
| Graphic provided by: StockCharts.com. |
| |
| Several indicators also reflect bearish concerns, as can be seen in this chart. Note the crossover of the 50- and 200-day exponential moving averages (EMAs). This type of cross from these prominent moving averages often signals a more serious downleg developing. In addition, the MACD (moving average convergence/divergence) and the RSI (relative strength indicator) both show weakness under key levels. Furthermore, the CMF (Chaiken money flow indicator) clearly shows a shift to bearish power. |
| Two downside targets are suggested: first, a previous congestion area in the $30 vicinity, and second, the pattern-fulfillment target by measurement of the widest part of the triangle as applied to below the breakdown point--leading to $20. A move back inside the triangle negates this bearish outlook and could lead to a test of the upper trendline. |
Independent Canadian equities trader and technical analyst based in Peterborough
Ontario, Canada.
| Website: | www.whatsonsale.ca/financial.html |
| E-mail address: | gwg7@sympatico.ca |
Click here for more information about our publications!
PRINT THIS ARTICLE

Request Information From Our Sponsors
- VectorVest, Inc.
- Executive Premier Workshop
- One-Day Options Course
- OptionsPro
- Retirement Income Workshop
- Sure-Fire Trading Systems (VectorVest, Inc.)
- Trading as a Business Workshop
- VectorVest 7 EOD
- VectorVest 7 RealTime/IntraDay
- VectorVest AutoTester
- VectorVest Educational Services
- VectorVest OnLine
- VectorVest Options Analyzer
- VectorVest ProGraphics v6.0
- VectorVest ProTrader 7
- VectorVest RealTime Derby Tool
- VectorVest Simulator
- VectorVest Variator
- VectorVest Watchdog
- StockCharts.com, Inc.
- Candle Patterns
- Candlestick Charting Explained
- Intermarket Technical Analysis
- John Murphy on Chart Analysis
- John Murphy's Chart Pattern Recognition
- John Murphy's Market Message
- MurphyExplainsMarketAnalysis-Intermarket Analysis
- MurphyExplainsMarketAnalysis-Visual Analysis
- StockCharts.com
- Technical Analysis of the Financial Markets
- The Visual Investor
