HOT TOPICS LIST
- MACD
- Fibonacci
- RSI
- Gann
- ADXR
- Stochastics
- Volume
- Triangles
- Futures
- Cycles
- Volatility
- ZIGZAG
- MESA
- Retracement
- Aroon
INDICATORS LIST
LIST OF TOPICS
PRINT THIS ARTICLE
by Koos van der Merwe
Starpoint Energy Trust completes the merger with APF Energy Trust.
Position: Accumulate
Koos van der Merwe
Has been a technical analyst since 1969, and has worked as a futures and options trader with First Financial Futures in Johannesburg, South Africa.
PRINT THIS ARTICLE
CUP WITH HANDLE
Starpoint Energy Trust/APF Energy Trust Deal
06/28/05 01:31:06 PMby Koos van der Merwe
Starpoint Energy Trust completes the merger with APF Energy Trust.
Position: Accumulate
| Starpoint Energy Trust announced on June 27 that it had closed its merger with APF Energy Trust. APF unit holders received 0.167 of a Rockyview Energy share, plus 0.63 of a Starpoint Energy Trust share. Without working out the actual calculations, let's see what Figure 1 tells us about Starpoint Energy Trust and Rockyview Energy Inc. (RVE-T). |
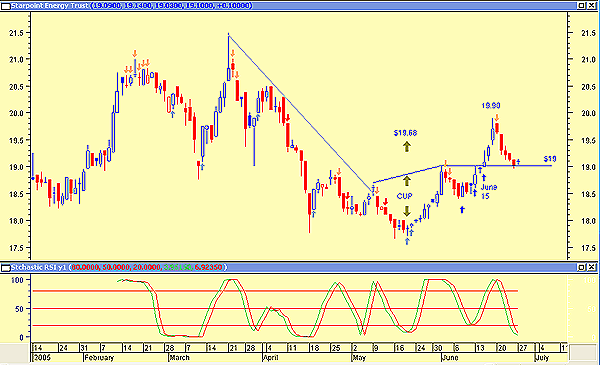
| Figure 1 shows how Starpoint recently formed a cup-and-handle formation, with the handle at $19. This was broken on June 15 as the price moved up strongly to a high of $19.90 by June 17. It fell back to test the support line, drawn from the handle of the cup-and-handle formation. What now? The target for the cup-and-handle formation is $19.68 (18.69 - 17.70 = 0.99 + 19.69 = 19.68). The price rose as high as $19.90, exceeding the target before falling back. |

|
| Figure 1: Starpoint Energy Trust |
| Graphic provided by: MetaStock. |
| |
To help me in my decision-making, I combined three indicators in MetaStock Expert Advisor. The indicators are:
My reasoning for the buy/sell triggers are as follows:
|
| I will use the Fisher transform plus TSI for a long-term position and the stochastic RSI formula for a short-term trade, with a rising stop of 8%. I will not short the stock. Note: All the MetaStock formulas are available from the MetaStock website. If you require a copy, email me. At the moment, even though the price is bouncing off the support at $19, there is no buy signal. I will hold off buying until I receive a signal, and not try to bottom-pick. Is the share worth buying, for growth or income? |
| Do note that Canadian income trusts pay shareholders a monthly dividend, and in the current low interest rate environment, they are very popular. At a price of $12.90, APF Energy Trust was offering a yield of 14.88% per annum. Starpoint, on the other hand, was offering a yield of 12.57% on a price of $19.10. The drop in price of the trust could be because of the lower yield offered. |
Has been a technical analyst since 1969, and has worked as a futures and options trader with First Financial Futures in Johannesburg, South Africa.
| Address: | 3256 West 24th Ave |
| Vancouver, BC | |
| Phone # for sales: | 6042634214 |
| E-mail address: | petroosp@gmail.com |
Click here for more information about our publications!
Comments
Date: 06/28/05Rank: 4Comment: 1) Possible a larger cup handle forming?
2) Better show all the indicators (TSI/fisher) mentioned in the chart.
Date: 06/30/05Rank: 3Comment:

Request Information From Our Sponsors
- StockCharts.com, Inc.
- Candle Patterns
- Candlestick Charting Explained
- Intermarket Technical Analysis
- John Murphy on Chart Analysis
- John Murphy's Chart Pattern Recognition
- John Murphy's Market Message
- MurphyExplainsMarketAnalysis-Intermarket Analysis
- MurphyExplainsMarketAnalysis-Visual Analysis
- StockCharts.com
- Technical Analysis of the Financial Markets
- The Visual Investor
- VectorVest, Inc.
- Executive Premier Workshop
- One-Day Options Course
- OptionsPro
- Retirement Income Workshop
- Sure-Fire Trading Systems (VectorVest, Inc.)
- Trading as a Business Workshop
- VectorVest 7 EOD
- VectorVest 7 RealTime/IntraDay
- VectorVest AutoTester
- VectorVest Educational Services
- VectorVest OnLine
- VectorVest Options Analyzer
- VectorVest ProGraphics v6.0
- VectorVest ProTrader 7
- VectorVest RealTime Derby Tool
- VectorVest Simulator
- VectorVest Variator
- VectorVest Watchdog
