HOT TOPICS LIST
- MACD
- Fibonacci
- RSI
- Gann
- ADXR
- Stochastics
- Volume
- Triangles
- Futures
- Cycles
- Volatility
- ZIGZAG
- MESA
- Retracement
- Aroon
INDICATORS LIST
LIST OF TOPICS
PRINT THIS ARTICLE
by David Penn
Indicators and chart patterns help traders anticipate market moves.
Position: N/A
David Penn
Technical Writer for Technical Analysis of STOCKS & COMMODITIES magazine, Working-Money.com, and Traders.com Advantage.
PRINT THIS ARTICLE
THE DIAMOND
Intraday Diamonds And Divergences
06/28/05 11:37:58 AMby David Penn
Indicators and chart patterns help traders anticipate market moves.
Position: N/A
| Trader Linda Bradford Raschke exhorts up-and-coming traders to learn how to "anticipate, not react." And while that sentiment runs somewhat counter to what other talented traders and market timers suggest is best for trading, it is hard to deny that the tools of technical trading, at least, provide methods for making reasonable bets on what is likely to happen--as well as methods for limiting the damage when the bet proves wrong. |
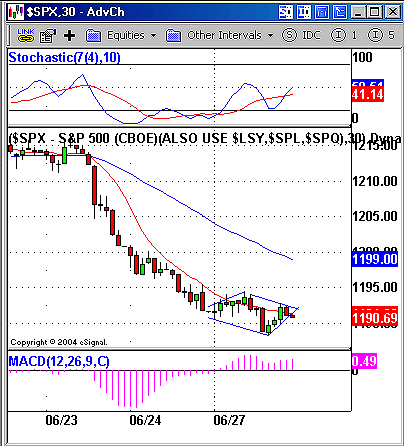
| Figure 1 shows how the Standard & Poor's 500 ended Monday, June 27. The market had seen a pair of surprisingly negative days to end the previous week. There were some voices anticipating an opportunity to buy the correction as early as Monday, and others urging caution. But the technicals pointed to, perhaps, a way for those quick-triggered traders who might care to split the difference. |

|
| Figure 1: The indicator in the pattern suggests that the breakout from this diamond consolidation is more likely to be to the upside than the downside. |
| Graphic provided by: eSignal. |
| |
| I've talked about how combinations of indicators and chart patterns can help technical traders anticipate directional moves such as breakouts and breakdowns. Note the diamond consolidation in the 30-minute chart of the S&P 500 in Figure 1. Diamond consolidations, as we recall from sources such as Thomas Bulkowski's Encyclopedia Of Chart Patterns, can serve as continuation patterns or reversal patterns. Coming as this one did at the end of an extended downtrend--note how far the 10-bar exponential moving average (EMA) (in red) is below the 50-bar EMA (in blue)--it could be argued that the diamond consolidation was more likely to anticipate a reversal rather than a continuation. But is there any additional evidence to support the notion of a move higher rather than lower? |
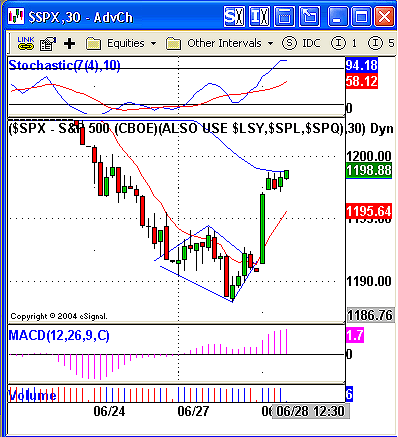
| This evidence existed in the form of the running positive stochastic divergence that began developing back on Friday, June 24. Note how as prices were moving lower and lower, the 7,10 stochastic was forming higher and higher price troughs. This tendency is characteristic of a market that is losing momentum on the downside, and capable--if not destined--to move higher in the near term. See Figure 2. |

|
| Figure 2: After breaking out from this diamond bottom, the S&P 500 developed a bullish flag that suggests even more gains before the rally is through. |
| Graphic provided by: eSignal. |
| |
| Which is precisely what the S&P 500 did upon opening on Tuesday, June 28. The measurement rule for the diamond anticipated a minimum move to about 1197, based on a diamond formation size of about 6 and a breakout at 1191. For traders who gamed the open based on the confluence of indicators and chart patterns embedded in yesterday's close, consider the mission accomplished. |
Technical Writer for Technical Analysis of STOCKS & COMMODITIES magazine, Working-Money.com, and Traders.com Advantage.
| Title: | Technical Writer |
| Company: | Technical Analysis, Inc. |
| Address: | 4757 California Avenue SW |
| Seattle, WA 98116 | |
| Phone # for sales: | 206 938 0570 |
| Fax: | 206 938 1307 |
| Website: | www.Traders.com |
| E-mail address: | DPenn@traders.com |
Traders' Resource Links | |
| Charting the Stock Market: The Wyckoff Method -- Books | |
| Working-Money.com -- Online Trading Services | |
| Traders.com Advantage -- Online Trading Services | |
| Technical Analysis of Stocks & Commodities -- Publications and Newsletters | |
| Working Money, at Working-Money.com -- Publications and Newsletters | |
| Traders.com Advantage -- Publications and Newsletters | |
| Professional Traders Starter Kit -- Software | |
Click here for more information about our publications!
Comments
Date: 06/28/05Rank: 4Comment: very good: Chart patterns with confirmation of indicators
Date: 06/28/05Rank: 5Comment:
Date: 06/30/05Rank: 4Comment:
Date: 07/05/05Rank: 4Comment:

Request Information From Our Sponsors
- VectorVest, Inc.
- Executive Premier Workshop
- One-Day Options Course
- OptionsPro
- Retirement Income Workshop
- Sure-Fire Trading Systems (VectorVest, Inc.)
- Trading as a Business Workshop
- VectorVest 7 EOD
- VectorVest 7 RealTime/IntraDay
- VectorVest AutoTester
- VectorVest Educational Services
- VectorVest OnLine
- VectorVest Options Analyzer
- VectorVest ProGraphics v6.0
- VectorVest ProTrader 7
- VectorVest RealTime Derby Tool
- VectorVest Simulator
- VectorVest Variator
- VectorVest Watchdog
- StockCharts.com, Inc.
- Candle Patterns
- Candlestick Charting Explained
- Intermarket Technical Analysis
- John Murphy on Chart Analysis
- John Murphy's Chart Pattern Recognition
- John Murphy's Market Message
- MurphyExplainsMarketAnalysis-Intermarket Analysis
- MurphyExplainsMarketAnalysis-Visual Analysis
- StockCharts.com
- Technical Analysis of the Financial Markets
- The Visual Investor
