HOT TOPICS LIST
- MACD
- Fibonacci
- RSI
- Gann
- ADXR
- Stochastics
- Volume
- Triangles
- Futures
- Cycles
- Volatility
- ZIGZAG
- MESA
- Retracement
- Aroon
INDICATORS LIST
LIST OF TOPICS
PRINT THIS ARTICLE
by David Penn
If your playbook reads "buy tech," does that make CSCO a go-to stock?
Position: N/A
David Penn
Technical Writer for Technical Analysis of STOCKS & COMMODITIES magazine, Working-Money.com, and Traders.com Advantage.
PRINT THIS ARTICLE
REVERSAL
Cisco Slips, Slides To Support
06/28/05 07:43:31 AMby David Penn
If your playbook reads "buy tech," does that make CSCO a go-to stock?
Position: N/A
| Jim Cramer, of TheStreet.com and CNBC's new Mad Money, has been taking more than his usual share of abuse by some in the financial media/punditcracy for his bullishness on technology. Perhaps we are not yet emerged from an era in which anyone who had the temerity to actually like technology stocks (as opposed to merely being willing and able to trade them, up or down) will be called a fool to his or her face. ... |
| But given the fundamentals to which money men like Cramer refer, being bullish on technology is far from a crazy man's move. After all, with oil prices soaring, now is the time to stay away from those companies that rely on lower fuel costs. Exit cyclicals and enter technology. And with the Federal Reserve still on a mission to tighten the nation's money supply, now is the time to stay away from those sectors and companies that live and breathe low interest rates. Exit retail and enter technology. |

|
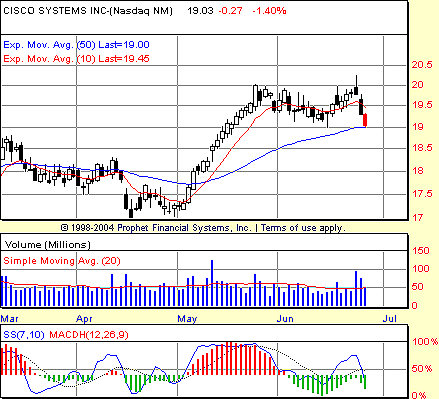
| Figure 1: Cisco. CSCO spent May in an uptrend, with only three negative days -- none of which were accompanied by outsized volume. |
| Graphic provided by: Prophet Financial, Inc. |
| |
| Nevertheless, what follows is another edition of "Given all this, here is why I'm a market technician." Cisco (CSCO), which was actually one of the tech stocks named by those who like technology here, spent May in the kind of uptrend that after-the-fact examples of technical analysis are made of (Figure 1). From a low just north of 17 to a high tipping 20 less than a month later, CSCO in May featured only three negative days--none of which arrived accompanied by particularly outsized volume. |
| But since late May, CSCO has spent more time moving sideways than soaring. The stock spent almost a month meandering in a horizontal trading range between 20 and 19 before making a higher high--on an intraday basis--on Thursday, June 23. |
| Unfortunately for Cisco bulls, this higher high is where things appear to have gone awry. Not only does the day's action itself form a bearish shooting star reversal candlestick, but also, the higher high marks a negative stochastic divergence--insofar as it is matched by a lower high in the 7,10 stochastic. A third negative with this higher high in price is that lack of follow-through to the upside on Friday (or Monday, for that matter) has created a 2B top reversal--a reversal that was confirmed with the downward price action on Friday, June 24. |
Technical Writer for Technical Analysis of STOCKS & COMMODITIES magazine, Working-Money.com, and Traders.com Advantage.
| Title: | Technical Writer |
| Company: | Technical Analysis, Inc. |
| Address: | 4757 California Avenue SW |
| Seattle, WA 98116 | |
| Phone # for sales: | 206 938 0570 |
| Fax: | 206 938 1307 |
| Website: | www.Traders.com |
| E-mail address: | DPenn@traders.com |
Traders' Resource Links | |
| Charting the Stock Market: The Wyckoff Method -- Books | |
| Working-Money.com -- Online Trading Services | |
| Traders.com Advantage -- Online Trading Services | |
| Technical Analysis of Stocks & Commodities -- Publications and Newsletters | |
| Working Money, at Working-Money.com -- Publications and Newsletters | |
| Traders.com Advantage -- Publications and Newsletters | |
| Professional Traders Starter Kit -- Software | |
Click here for more information about our publications!
Comments
Date: 06/28/05Rank: 3Comment: TA is okay, but CSCO is not a hot stock anymore. Not worthing trading it.
Date: 06/30/05Rank: 4Comment:

Request Information From Our Sponsors
- StockCharts.com, Inc.
- Candle Patterns
- Candlestick Charting Explained
- Intermarket Technical Analysis
- John Murphy on Chart Analysis
- John Murphy's Chart Pattern Recognition
- John Murphy's Market Message
- MurphyExplainsMarketAnalysis-Intermarket Analysis
- MurphyExplainsMarketAnalysis-Visual Analysis
- StockCharts.com
- Technical Analysis of the Financial Markets
- The Visual Investor
- VectorVest, Inc.
- Executive Premier Workshop
- One-Day Options Course
- OptionsPro
- Retirement Income Workshop
- Sure-Fire Trading Systems (VectorVest, Inc.)
- Trading as a Business Workshop
- VectorVest 7 EOD
- VectorVest 7 RealTime/IntraDay
- VectorVest AutoTester
- VectorVest Educational Services
- VectorVest OnLine
- VectorVest Options Analyzer
- VectorVest ProGraphics v6.0
- VectorVest ProTrader 7
- VectorVest RealTime Derby Tool
- VectorVest Simulator
- VectorVest Variator
- VectorVest Watchdog
