HOT TOPICS LIST
- MACD
- Fibonacci
- RSI
- Gann
- ADXR
- Stochastics
- Volume
- Triangles
- Futures
- Cycles
- Volatility
- ZIGZAG
- MESA
- Retracement
- Aroon
INDICATORS LIST
LIST OF TOPICS
PRINT THIS ARTICLE
by David Penn
A diamond top sent copper futures down in May. But the subsequent bounce had to be seen to be believed.
Position: N/A
David Penn
Technical Writer for Technical Analysis of STOCKS & COMMODITIES magazine, Working-Money.com, and Traders.com Advantage.
PRINT THIS ARTICLE
REVERSAL
Copper Diamonds And Divergences
06/27/05 11:42:02 AMby David Penn
A diamond top sent copper futures down in May. But the subsequent bounce had to be seen to be believed.
Position: N/A
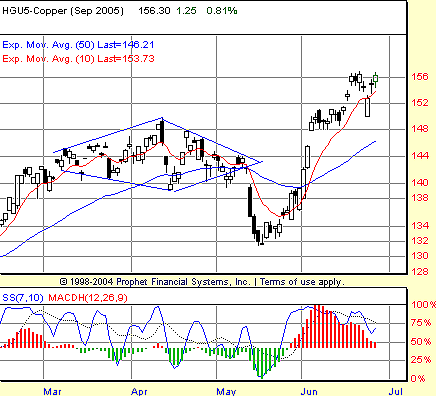
| My last look at copper futures was a little over a month ago. Then, I took note of the diamond top formation that stretched from early March to mid-May 2005 ("Copper's Diamond Down," May 18, 2005, Traders.com Advantage). At the time, I suggested a minimum downside to the 1.32 level as the most likely destination for a breakdown. This $1.32 was basis July futures. Using the September contract as our copper proxy, this downside minimum target works out to about the same level (13210, to be specific). |
| Apparently, though, that downside target arrived stamped "This Much and No Further." September copper fell to 1.31 in early May before abruptly stopping and holding. In a matter of days--and without the warning of a positive divergence or volume surge--copper futures were on their way back up. In June, September copper gapped up beyond the level of the breakdown near 1.44, and by mid-month it had soared above the level of the diamond top. |

|
| Figure 1: An abrupt turnaround followed the May breakdown from a diamond consolidation. In late June, a negative divergence threatened to slow copper's early summer advance. |
| Graphic provided by: Prophet Financial, Inc. |
| |
| This is where we find September copper in late June, and there are a number of features that characterize those futures at this time. First, HGU5's 10-day exponential moving average (EMA) has separated itself from the 50-day EMA by a sizable six-and-a-half cent spread, with HGU5 trading a few cents higher still. This suggests an advance that is probably overextended and due for some measure of pullback. |
| Second, the moving average convergence/divergence histogram (MACDH) is very strong in June. Even later in the month, the histogram has subsided some; it remains higher than it had been over the past several months. This is another bullish development on balance, insofar as it suggests the buying momentum remains powerful. |
| Third is the behavior of the 7,10 stochastic. This oscillator is showing an intramonth, or short-term, negative divergence between the higher highs in price from early June to late June and the lower highs in the stochastic over the same period. Because of the strength of the histogram--and the extended nature of the market revealed through the moving averages--it seems more likely that copper might move sideways by way of correction instead of moving sharply lower. Right now, the gap up level at 1.48 is likely to provide initial support for any decline. |
Technical Writer for Technical Analysis of STOCKS & COMMODITIES magazine, Working-Money.com, and Traders.com Advantage.
| Title: | Technical Writer |
| Company: | Technical Analysis, Inc. |
| Address: | 4757 California Avenue SW |
| Seattle, WA 98116 | |
| Phone # for sales: | 206 938 0570 |
| Fax: | 206 938 1307 |
| Website: | www.Traders.com |
| E-mail address: | DPenn@traders.com |
Traders' Resource Links | |
| Charting the Stock Market: The Wyckoff Method -- Books | |
| Working-Money.com -- Online Trading Services | |
| Traders.com Advantage -- Online Trading Services | |
| Technical Analysis of Stocks & Commodities -- Publications and Newsletters | |
| Working Money, at Working-Money.com -- Publications and Newsletters | |
| Traders.com Advantage -- Publications and Newsletters | |
| Professional Traders Starter Kit -- Software | |
Click here for more information about our publications!
Comments
Date: 06/27/05Rank: 2Comment:
Date: 07/05/05Rank: 4Comment:

Request Information From Our Sponsors
- StockCharts.com, Inc.
- Candle Patterns
- Candlestick Charting Explained
- Intermarket Technical Analysis
- John Murphy on Chart Analysis
- John Murphy's Chart Pattern Recognition
- John Murphy's Market Message
- MurphyExplainsMarketAnalysis-Intermarket Analysis
- MurphyExplainsMarketAnalysis-Visual Analysis
- StockCharts.com
- Technical Analysis of the Financial Markets
- The Visual Investor
- VectorVest, Inc.
- Executive Premier Workshop
- One-Day Options Course
- OptionsPro
- Retirement Income Workshop
- Sure-Fire Trading Systems (VectorVest, Inc.)
- Trading as a Business Workshop
- VectorVest 7 EOD
- VectorVest 7 RealTime/IntraDay
- VectorVest AutoTester
- VectorVest Educational Services
- VectorVest OnLine
- VectorVest Options Analyzer
- VectorVest ProGraphics v6.0
- VectorVest ProTrader 7
- VectorVest RealTime Derby Tool
- VectorVest Simulator
- VectorVest Variator
- VectorVest Watchdog
