HOT TOPICS LIST
- MACD
- Fibonacci
- RSI
- Gann
- ADXR
- Stochastics
- Volume
- Triangles
- Futures
- Cycles
- Volatility
- ZIGZAG
- MESA
- Retracement
- Aroon
INDICATORS LIST
LIST OF TOPICS
PRINT THIS ARTICLE
by Luis Ferro
The formation of a bullish flag in Intel suggests higher prices for the chip manufacturer, and the analysis of the longer-term trend also supports this forecast.
Position: Buy
Luis Ferro
Trader and technical analyst living in Bern, Switzerland. A full member of the STA, currently enrolled in the DITA program and the CMT program.
PRINT THIS ARTICLE
FLAGS AND PENNANTS
Bullish Flag For Intel
06/27/05 09:04:09 AMby Luis Ferro
The formation of a bullish flag in Intel suggests higher prices for the chip manufacturer, and the analysis of the longer-term trend also supports this forecast.
Position: Buy
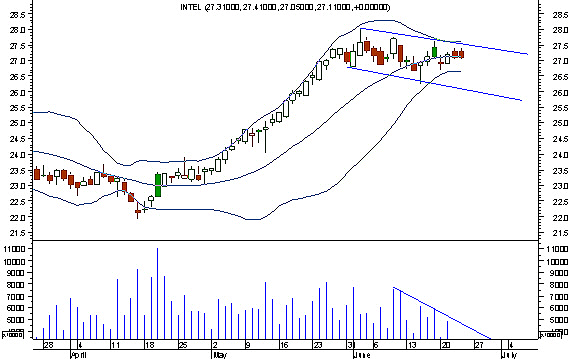
| Following a period of horizontal movement, Intel staged an unusually strong rally (with 20 up days out of a total of 21, which was how long the uptrend lasted) that stopped at 28, after which a bullish flag was formed. This pattern occurs when there is a decline in prices bounded by two parallel trendlines, and normally, the decline should not be very pronounced. It is generally considered a reliable pattern, but it is important to pay attention to two characteristics: volume should decline along the formation, as in any consolidation pattern, and the flag should also be preceded by a strong uptrend. In the case of Intel, that is exactly what is happening, increasing the probabilities of a successful breakout. |

|
| Figure 1: Intel. Daily chart of INTC with Bollinger Bands. |
| Graphic provided by: MetaStock. |
| |
| In chart formations, flags are said to fly at half mast, meaning that after the stock breaks from the formation, it often rises an amount equal to the uptrend that preceded the flag. This makes it possible to calculate a price objective for flag patterns. In the case of Intel, the uptrend that led to the flag formation is equal to 5 (28-23), and assuming that the lowest level in the flag will be 26, the target price if the stock breaks above the upper trendline will be 31. The tightening of the Bollinger Bands after a period of strong expansion of the bands is also significant, because it normally precedes a strong directional movement. (See Figure 1.) |

|
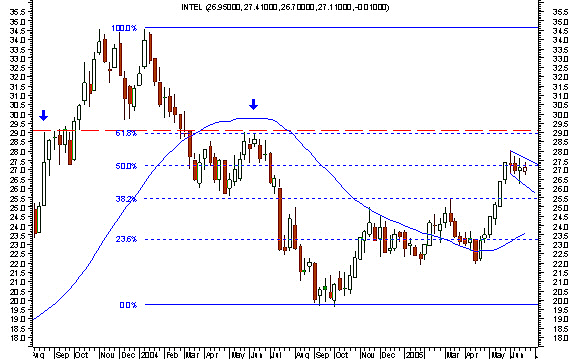
| Figure 2: Intel. Weekly chart of INTC with 40-week moving average, Fibonacci retracements, and showing resistance at 29. |
| Graphic provided by: MetaStock. |
| |
| On the weekly chart (Figure 2), there are two important technical factors that must be looked into. First, Intel was finally able to rise above the 40-week moving average (equivalent to the 200-day MA), which helps to support the conclusion that the long-term trend is currently upward. So in buying Intel we would also be trading in the direction of the long-term trend. There is also an important horizontal level at 29 (marked with arrows and the red horizontal line on the chart), which coincides with a key Fibonacci retracement, 61.8%. When two different types of support and resistance converge at the same level, it increases significantly the importance of that same level. Consequently, caution should be exercised if and when Intel approaches 29. |
| Until now, prices have not broken above the upper trendline, and until they do, the flag cannot be considered complete. In addition, flags are short-term patterns, normally lasting up to three weeks. If it lasts much longer, it should be regarded with suspicion, and even if prices break upward, the chances of the pattern failing will greatly increase. |
Trader and technical analyst living in Bern, Switzerland. A full member of the STA, currently enrolled in the DITA program and the CMT program.
| Address: | Switzerland |
| E-mail address: | luispgsf@yahoo.com |
Click here for more information about our publications!
Comments
Date: 06/27/05Rank: 4Comment:
Date: 06/27/05Rank: 1Comment:

Request Information From Our Sponsors
- StockCharts.com, Inc.
- Candle Patterns
- Candlestick Charting Explained
- Intermarket Technical Analysis
- John Murphy on Chart Analysis
- John Murphy's Chart Pattern Recognition
- John Murphy's Market Message
- MurphyExplainsMarketAnalysis-Intermarket Analysis
- MurphyExplainsMarketAnalysis-Visual Analysis
- StockCharts.com
- Technical Analysis of the Financial Markets
- The Visual Investor
- VectorVest, Inc.
- Executive Premier Workshop
- One-Day Options Course
- OptionsPro
- Retirement Income Workshop
- Sure-Fire Trading Systems (VectorVest, Inc.)
- Trading as a Business Workshop
- VectorVest 7 EOD
- VectorVest 7 RealTime/IntraDay
- VectorVest AutoTester
- VectorVest Educational Services
- VectorVest OnLine
- VectorVest Options Analyzer
- VectorVest ProGraphics v6.0
- VectorVest ProTrader 7
- VectorVest RealTime Derby Tool
- VectorVest Simulator
- VectorVest Variator
- VectorVest Watchdog
