HOT TOPICS LIST
- MACD
- Fibonacci
- RSI
- Gann
- ADXR
- Stochastics
- Volume
- Triangles
- Futures
- Cycles
- Volatility
- ZIGZAG
- MESA
- Retracement
- Aroon
INDICATORS LIST
LIST OF TOPICS
PRINT THIS ARTICLE
by Sean Moore
Recognizing chart formations as they form can give you an inside edge in trading. Wedge formations are similar to triangle formations and can be used to help identify highs or lows.
Position: N/A
Sean Moore
Traders.com Staff Writer.
PRINT THIS ARTICLE
WEDGE FORMATIONS
Charting Patterns - Rising Wedge
07/14/00 12:35:36 PMby Sean Moore
Recognizing chart formations as they form can give you an inside edge in trading. Wedge formations are similar to triangle formations and can be used to help identify highs or lows.
Position: N/A
| Like many chart formations, wedge formations attempt to identify areas of support and resistance. Unlike a support/resistance channel, the support and resistance lines of a wedge formation are not drawn parallel to each other. Instead the lines are drawn to converge, giving the formation a wedge appearance. This is similar to a triangle formation, and when analyzing the formation, you still look for breakouts from the support or resistance areas. |
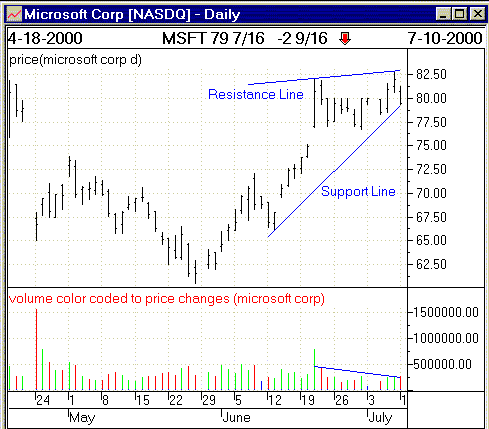
| The wedge formation that is likely to occur at a market high is called the rising wedge. In a rising wedge, both the support and resistance lines have positive slopes, but the support line will be steeper than the resistance line. If the price breaks below this support line, it is likely that the price will fall to the wedge bottom. This formation is very similar to the ascending triangle, with the only difference being that the resistance line will be upward sloping instead of horizontal. Another common factor to look for with the rising wedge is declining volume. |

|
| Figure 1: Daily price chart for Micosoft Corp. Support and resistance lines form a rising wedge. |
| Graphic provided by: Window. |
| |
| For an example of the rising wedge formation, look at the daily price chart for Microsoft Corp. [MSFT], shown in Figure 1. By drawing a support line through the local lows, and a resistance line through the local highs, you can clearly see the wedge forming. As expected, this pattern is accompanied by declining volume. If the price does break below this sharp support line, the next support area could likely be around the $60 /share range which would be a substantial drop, so approach this stock cautiously, at least from a technical standpoint. |
Traders.com Staff Writer.
| Title: | Project Engineer |
| Company: | Technical Analysis, Inc. |
| Address: | 4757 California Ave. SW |
| Seattle, WA 98116 | |
| Phone # for sales: | 206 938 0570 |
| Fax: | 206 938 1307 |
| Website: | Traders.com |
| E-mail address: | smoore@traders.com |
Traders' Resource Links | |
| Charting the Stock Market: The Wyckoff Method -- Books | |
| Working-Money.com -- Online Trading Services | |
| Traders.com Advantage -- Online Trading Services | |
| Technical Analysis of Stocks & Commodities -- Publications and Newsletters | |
| Working Money, at Working-Money.com -- Publications and Newsletters | |
| Traders.com Advantage -- Publications and Newsletters | |
| Professional Traders Starter Kit -- Software | |
Click here for more information about our publications!
Comments
Date: / /Rank: 4Comment:
Date: 02/10/01Rank: 1Comment:

Request Information From Our Sponsors
- VectorVest, Inc.
- Executive Premier Workshop
- One-Day Options Course
- OptionsPro
- Retirement Income Workshop
- Sure-Fire Trading Systems (VectorVest, Inc.)
- Trading as a Business Workshop
- VectorVest 7 EOD
- VectorVest 7 RealTime/IntraDay
- VectorVest AutoTester
- VectorVest Educational Services
- VectorVest OnLine
- VectorVest Options Analyzer
- VectorVest ProGraphics v6.0
- VectorVest ProTrader 7
- VectorVest RealTime Derby Tool
- VectorVest Simulator
- VectorVest Variator
- VectorVest Watchdog
- StockCharts.com, Inc.
- Candle Patterns
- Candlestick Charting Explained
- Intermarket Technical Analysis
- John Murphy on Chart Analysis
- John Murphy's Chart Pattern Recognition
- John Murphy's Market Message
- MurphyExplainsMarketAnalysis-Intermarket Analysis
- MurphyExplainsMarketAnalysis-Visual Analysis
- StockCharts.com
- Technical Analysis of the Financial Markets
- The Visual Investor
