HOT TOPICS LIST
- MACD
- Fibonacci
- RSI
- Gann
- ADXR
- Stochastics
- Volume
- Triangles
- Futures
- Cycles
- Volatility
- ZIGZAG
- MESA
- Retracement
- Aroon
INDICATORS LIST
LIST OF TOPICS
PRINT THIS ARTICLE
by Paolo Pezzutti
Indications are for a continuation of the trading range.
Position: N/A
Paolo Pezzutti
Author of the book "Trading the US Markets - A Comprehensive Guide to US Markets for International Traders and Investors" - Harriman House (July 2008)
PRINT THIS ARTICLE
NYMEX Crude Oil: Near All-Time Highs
06/27/05 08:38:16 AMby Paolo Pezzutti
Indications are for a continuation of the trading range.
Position: N/A
| The news media is noting the pressure of rising oil prices. The price increase over the past six years is due to constraints in the supply as global demand has accelerated, fueled by strong global economic growth. Most members of the OPEC are pumping to full capacity. Non-OPEC supply is flat, especially in Russia. There is growing concern about the lack of spare oil production capacity in the event of significant supply disruptions. The supply is not adapting quickly enough to strong demand. Increasing the pumping capacity requires time and expensive investments. Last week, oil prices rose on the threat of an oil workers' strike in Norway. In response, OPEC unofficially raised its price target, citing firm demand growth, refining bottlenecks, and lack of economic damage from high oil prices. OPEC ministers agreed to add 500,000 barrels a day to the official quota to take it to 28 million barrels a day. China's imports of crude oil in May were up 8.2% from a year ago. A report on Chinese television stated that Beijing could decide to begin filling its newly constructed strategic oil reserves at the end of this year and place additional strain on global markets in the fourth quarter. In the stock market, the last two sessions printed dropping prices with wide range days--a sign that something has changed in investors' perception, at least in the short term. At the same time, after a short consolidation period, bond prices are trying to retest their highs. Markets are anticipating a slowdown in the economy. |
| But let's see how oil has performed recently, regardless of alarmist press reports. I used the moving average convergence/divergence (MACD) to support the analysis. It calculates two exponential moving averages (EMAs) of lengths specified by inputs. The difference between these two averages is then plotted as the MACD. This value is also averaged for the number of bars specified by another input and then plotted as the MACD average. Finally, the difference between the MACD and the MACD average is calculated and plotted as the MACDDiff. The TradeStation online help reported it this way: "As a trend-following indicator, the MACD may be interpreted similarly to other moving averages. When the MACD crosses above the MACD average, it may be the beginning of an uptrend. Conversely, when the MACD crosses below the MACD average, it may be the beginning of a downtrend. As an oscillator, the MACD can indicate overbought and oversold conditions." It looks simple, but actually, it is not so easy to understand whether you have to interpret the indicator in trend mode or switch to trading range mode. But in my opinion, this is the greatest challenge for every trader! |

|
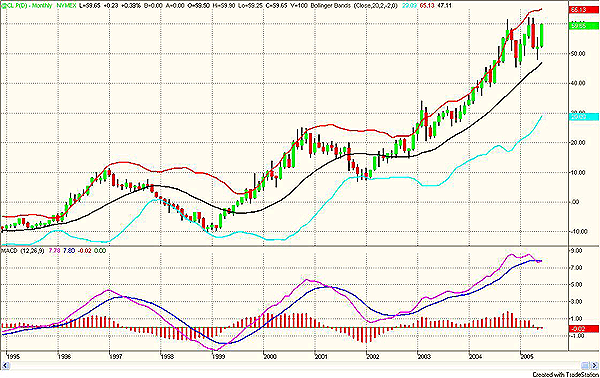
| Figure 1: The monthly NYMEX crude oil futures continuous contract chart displays the impressive uptrend of the past 10 years. |
| Graphic provided by: TradeStation. |
| |
| In Figure 1, you can see the monthly chart of the NYMEX crude oil continuous contract. It displays the strong uptrend of the past 10 years. Prices are very close to their all-time highs, but at the same levels of October 2004. They have lost contact with the upper Bollinger Band. The MACD printed a double top and is turning down. Prices spent the last months in trading range and now are retesting their highs. |

|
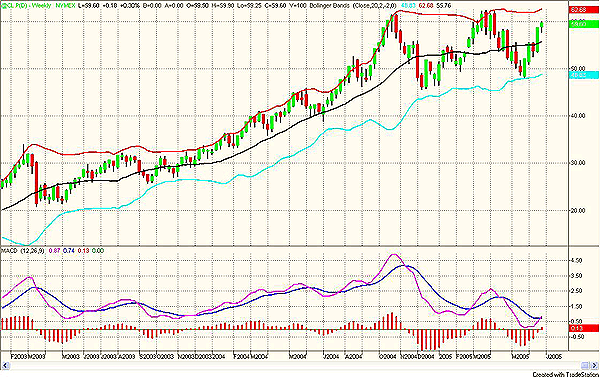
| Figure 2: This weekly chart displays the big swings of the past nine months. Oil is approaching resistance at $62.50. |
| Graphic provided by: TradeStation. |
| |
| In Figure 2, the weekly chart is much more interesting. The trading range is characterized by big swings developed in the past months, and that is still continuing. Note the important negative divergence of MACD when prices retested the top for the first time at the end of April 2005. MACD now has turned up again, supporting the third tentative breakout to the upside. Bollinger Bands are flat and indicate the current trading range phase. |

|
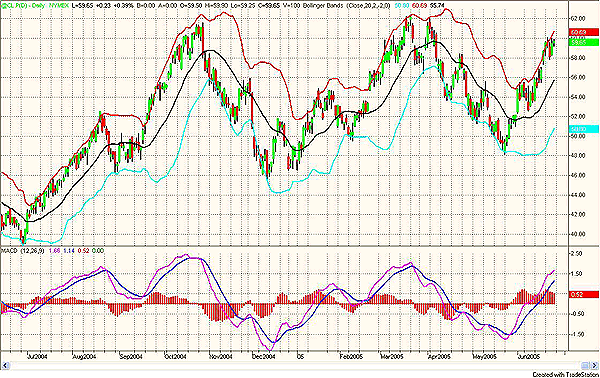
| Figure 3: The daily chart displays the strength of oil during the current leg that brought prices from a relative low printed in May at $48 to the present $60. |
| Graphic provided by: TradeStation. |
| |
| In Figure 3, the daily chart displays a positive and rising MACD. MACDDiff is declining. Prices are no longer in contact with the upper and rising Bollinger Band. Prices are getting into resistance in a trading range environment. It is difficult to say how this will evolve. I would expect that the trading range will continue, with resistance at previous highs at $62 still being effective. Given the possibility of a global slowdown of the economy, a catalyst exists to provide indications for a test failure of the high. Given the current market conditions, being a contrarian is risky but very rewarding, because volatility is high. |
Author of the book "Trading the US Markets - A Comprehensive Guide to US Markets for International Traders and Investors" - Harriman House (July 2008)
| Address: | VIA ROBERTO AGO 26 POSTAL CODE 00166 |
| Rome, ITALY | |
| Phone # for sales: | +393357540708 |
| E-mail address: | pezzutti.paolo@tiscali.it |
Click here for more information about our publications!
Comments
Date: 06/27/05Rank: 3Comment:
Date: 06/27/05Rank: 5Comment: good analysis
Date: 06/27/05Rank: 3Comment: Charts not clear
Use bigger images
Date: 07/05/05Rank: 5Comment:

Request Information From Our Sponsors
- VectorVest, Inc.
- Executive Premier Workshop
- One-Day Options Course
- OptionsPro
- Retirement Income Workshop
- Sure-Fire Trading Systems (VectorVest, Inc.)
- Trading as a Business Workshop
- VectorVest 7 EOD
- VectorVest 7 RealTime/IntraDay
- VectorVest AutoTester
- VectorVest Educational Services
- VectorVest OnLine
- VectorVest Options Analyzer
- VectorVest ProGraphics v6.0
- VectorVest ProTrader 7
- VectorVest RealTime Derby Tool
- VectorVest Simulator
- VectorVest Variator
- VectorVest Watchdog
- StockCharts.com, Inc.
- Candle Patterns
- Candlestick Charting Explained
- Intermarket Technical Analysis
- John Murphy on Chart Analysis
- John Murphy's Chart Pattern Recognition
- John Murphy's Market Message
- MurphyExplainsMarketAnalysis-Intermarket Analysis
- MurphyExplainsMarketAnalysis-Visual Analysis
- StockCharts.com
- Technical Analysis of the Financial Markets
- The Visual Investor
