HOT TOPICS LIST
- MACD
- Fibonacci
- RSI
- Gann
- ADXR
- Stochastics
- Volume
- Triangles
- Futures
- Cycles
- Volatility
- ZIGZAG
- MESA
- Retracement
- Aroon
INDICATORS LIST
LIST OF TOPICS
PRINT THIS ARTICLE
by Paolo Pezzutti
This pattern provides interesting short-term trading opportunities.
Position: N/A
Paolo Pezzutti
Author of the book "Trading the US Markets - A Comprehensive Guide to US Markets for International Traders and Investors" - Harriman House (July 2008)
PRINT THIS ARTICLE
Short-Term Patterns: 80-20
06/24/05 10:41:27 AMby Paolo Pezzutti
This pattern provides interesting short-term trading opportunities.
Position: N/A
Linda Bradford Raschke and Laurence A. Connors, in their famous book Street Smarts: High Probability Short-Term Trading Strategies, introduced the 80-20 pattern. Statistics say that on days that close in the top 10% of their range, the next day tends to print a higher high but close lower. The numbers are quite interesting. Raschke and Connors report that you have a 80-90% probability of a followthrough the next morning for a retest of the previous high. Price, however, close higher only 50% of the time. The opposite is also true when considering a retest of lows. The book was printed in 1995, but I have conducted some research on the main futures contracts and have confirmed this behavior. There is a stong chance of a midday reversal pattern. The authors then worked on filters to have an acceptable tradeoff between trading opportunities and statistical support for a high-probability trade. They propose to look at setup bars with the open in the lower 20% of its daily range and the close in the upper 80% range. This represents a sell setup for the next day (vice versa for buys). The rules for buys are (reversed for sells):
|
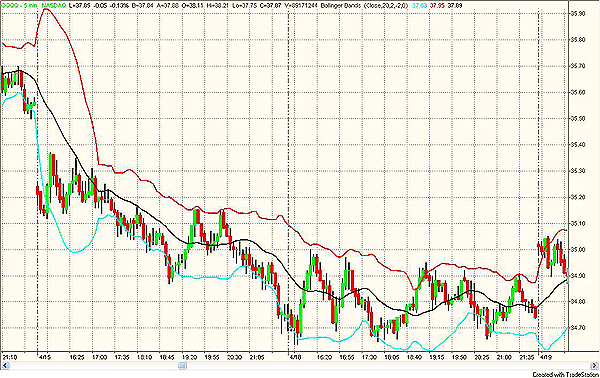
| Here are some examples: In Figure 1, you can see that on April 15, 2005, QQQQ printed a setup for a buy on the next day. In fact, the market opened in the top 20% of the daily range and closed in the lower 20% of the range. On the next trading session, April 18, 2005, QQQQ opened within the previous day's range and printed a new low at 34.64 within the first 15 minutes. There were not many ticks below the previous low (only 4). Prices went above the previous low, giving a buy signal. A protective stop would be placed below 34.64. During the session, which happened to be a trading range day, the stop was never hit, and it closed at 34.74. Depending on your exit rule, you could exit at the close or carry the trade over to the next day's open, which, in this case, would have been the best choice. However, after a choppy day, statistically I would not expect a higher open the next day. |

|
| Figure 1: The QQQQ five-minute chart display on April 15 shows a 80-20 buy setup. Prices opened in the top 80% and closed in the lower 20% of the daily range. |
| Graphic provided by: TradeStation. |
| |
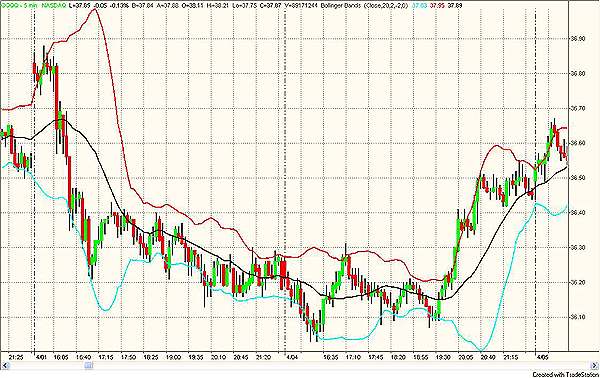
| In Figure 2, you can see that on April 1, QQQQ printed a buy setup for the next day. On April 4, prices went quickly below the previous day's low. At 16:15, a low was printed at 36.03. After 10 minutes, the low was tested again and then prices moved upward above 36.13, giving a buy signal. After moving sideways for a few hours, finally prices rallied closing at 36.45. The next day, QQQQ opened with a gap up. |

|
| Figure 2: The QQQQ five-minute chart prints another buy setup on April 1. The next day, this trade was well rewarded. |
| Graphic provided by: TradeStation. |
| |
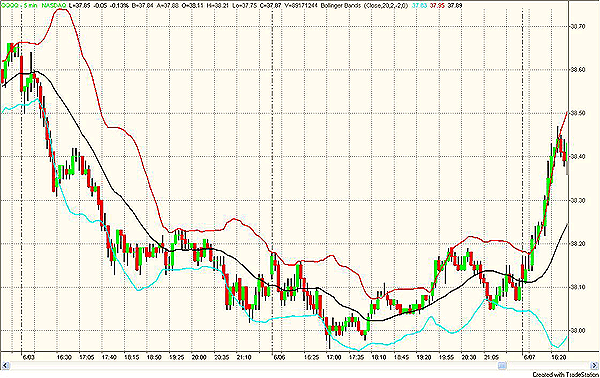
| In Figure 3, QQQQ printed another buy setup on June 3 with a low at 38.02. The next day, prices reached a low of 37.96 at 17:05. After that, prices entered the previous day's range at 17:10, giving a buy signal. The protective stop placed at 38.02 was never hit and QQQQ closed at 38.10. It was another trading range day. |

|
| Figure 3: The QQQQ five-minute chart prints another buy setup on June 3. The next day, although the stop-loss level was never hit, prices moved sideways. |
| Graphic provided by: TradeStation. |
| |
| The 80-20 is a low-risk pattern for daytraders. It represents a failure test of the previous day's high/low. In its logic, it is similar to other patterns (turtle soup, OOPS). It is a short-term pattern, without implications in the long-term trend. You can have fun adding filters to improve the statistic advantage. In this regard, the authors suggest you look at the size of the bar, but you can find several other little twists. It can happen that you get stopped very soon, especially if the low is not many ticks away from the setup day low. Or it may happen that the price action does not reward you very much, moving sideways after you enter the trade. You can get little wins or little losses, but sometimes you catch the big fish. You can profit from reversals using these patterns. Markets display a rhythm of contractions and expansions, trends and congestions. These patterns profit from the natural rhythm of buying and selling pressure based on the investors' psychology. Investors put fresh money in the market, take a profit, expect a trend confirmation, reenter the market in the direction of the prevailing trend, and so forth. As for other short-term patterns, the pattern profitability depends at least on:
It's a good idea to conduct tests taking into account the these parameters. Many times you may find yourself stopped out because of the market noise or some engineered move after which the market goes your way again. The pattern has its validity and statistical value. Oftentimes, markets tend to retrace after printing new highs/lows, which means you can find a profit opportunity. |
Author of the book "Trading the US Markets - A Comprehensive Guide to US Markets for International Traders and Investors" - Harriman House (July 2008)
| Address: | VIA ROBERTO AGO 26 POSTAL CODE 00166 |
| Rome, ITALY | |
| Phone # for sales: | +393357540708 |
| E-mail address: | pezzutti.paolo@tiscali.it |
Click here for more information about our publications!
Comments
Date: 06/25/05Rank: 3Comment:
Date: 06/30/05Rank: 5Comment:

Request Information From Our Sponsors
- StockCharts.com, Inc.
- Candle Patterns
- Candlestick Charting Explained
- Intermarket Technical Analysis
- John Murphy on Chart Analysis
- John Murphy's Chart Pattern Recognition
- John Murphy's Market Message
- MurphyExplainsMarketAnalysis-Intermarket Analysis
- MurphyExplainsMarketAnalysis-Visual Analysis
- StockCharts.com
- Technical Analysis of the Financial Markets
- The Visual Investor
- VectorVest, Inc.
- Executive Premier Workshop
- One-Day Options Course
- OptionsPro
- Retirement Income Workshop
- Sure-Fire Trading Systems (VectorVest, Inc.)
- Trading as a Business Workshop
- VectorVest 7 EOD
- VectorVest 7 RealTime/IntraDay
- VectorVest AutoTester
- VectorVest Educational Services
- VectorVest OnLine
- VectorVest Options Analyzer
- VectorVest ProGraphics v6.0
- VectorVest ProTrader 7
- VectorVest RealTime Derby Tool
- VectorVest Simulator
- VectorVest Variator
- VectorVest Watchdog
