HOT TOPICS LIST
- MACD
- Fibonacci
- RSI
- Gann
- ADXR
- Stochastics
- Volume
- Triangles
- Futures
- Cycles
- Volatility
- ZIGZAG
- MESA
- Retracement
- Aroon
INDICATORS LIST
LIST OF TOPICS
PRINT THIS ARTICLE
by David Penn
As oil stocks bound to new highs, crude oil futures show signs of weariness.
Position: N/A
David Penn
Technical Writer for Technical Analysis of STOCKS & COMMODITIES magazine, Working-Money.com, and Traders.com Advantage.
PRINT THIS ARTICLE
OVERBOUGHT OVERSOLD
September Crude's Bearish Divergence
06/24/05 08:50:36 AMby David Penn
As oil stocks bound to new highs, crude oil futures show signs of weariness.
Position: N/A
| It is an intramarket conceit that the commodity stocks tend to lead the price action of the underlying commodity--that is to say, gold stocks tend to lead the price of gold, and oil stocks tend to lead the price of oil. While not a hard and fast rule (markets, after all, will do what they want to do), this tendency is worth keeping in mind while trying to gauge the impact and magnitude of price breakouts and corrections in both. |
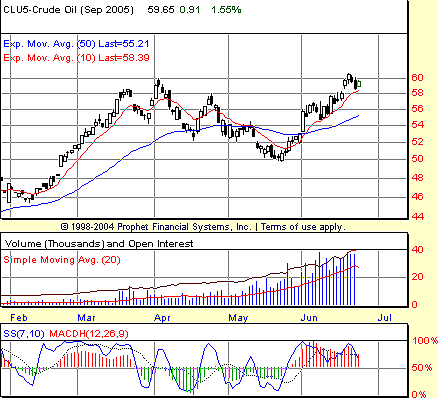
| I think of these tendencies when looking at charts of crude oil futures, as represented by the September crude oil contract, and crude oil stocks, as represented by the oil stock HOLDRS (OIH) or the Philadelphia Oil Stock Index ($OSX). Note first in Figure 1 how September crude has formed a negative stochastic divergence in June, with lower highs in the 7,10 stochastic being matched by higher highs in price. |

|
| Figure 1: With the June MACD histogram still showing strength on the part of the bulls, the negative stochastic divergence of that month is more likely to lead to a correction than a breakdown. |
| Graphic provided by: Prophet Financial, Inc. |
| |
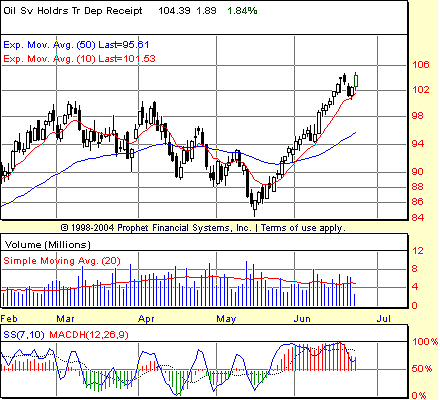
| Negative divergences involving the 7,10 stochastic indicate, at a minimum, that the upside is temporarily limited. Whether a full-fledged correction--to say nothing of a breakdown or reversal--is likely is another question entirely. But for now, those on the long side of crude oil should consider that the market might have gotten ahead of itself and could easily pull back toward support, perhaps at the 50-day exponential moving average (EMA). Two factors argue that crude oil will experience a pullback rather than a reversal. The first is the strength of the moving average convergence/divergence histogram (MACDH) in June. As I wrote recently of the Standard & Poor's 100 ("Big Trouble In Little Histograms," Traders.com Advantage, June 23, 2005), fading strongly positive histogram readings--even with the wind of a negative stochastic divergence at one's back--is a dicey business. It is often a surer play to wait for signs of weakness in the histogram (that is, less positive, "shorter" bars) before betting against the market that the histogram is tracking. As the example of the $OEX is currently showing, that "less positive" histogram is often accompanied by a negative stochastic divergence as well. The second factor is the relative strength of oil stocks. While these stocks have moved up strongly for a full month since putting in an intermediate bottom in mid-May, they have shown little sign of pulling back significantly. In fact, as the OIH shows, these stocks are bounding to new highs in June--new highs that are not accompanied by a negative stochastic divergence. |

|
| Figure 2: The magnitude of the OIH's MACD histogram in June suggests strongly that a top has not been put in--however extended prices may be. |
| Graphic provided by: Prophet Financial, Inc. |
| |
| Figure 2, the chart of the OIH, brings to mind the axiom of Jesse Livermore as retold in Reminiscences Of A Stock Operator: "Prices are never too low to sell and never too high to buy." If the OIH refuses to pull back, then there really is no other way for OIH to continue to advance other than to move other than vertically at this point. The strongly positive MACD histogram and the absence of a negative stochastic divergence both argue against a top even at these lofty levels. |
| Further, if indeed commodity stocks tend to lead the underlying commodity, then there is additional evidence that the bearish stochastic in September crude is less likely to result in a massive reversal of fortunes for those who have been enjoying the rally over the past 30-odd days. |
Technical Writer for Technical Analysis of STOCKS & COMMODITIES magazine, Working-Money.com, and Traders.com Advantage.
| Title: | Technical Writer |
| Company: | Technical Analysis, Inc. |
| Address: | 4757 California Avenue SW |
| Seattle, WA 98116 | |
| Phone # for sales: | 206 938 0570 |
| Fax: | 206 938 1307 |
| Website: | www.Traders.com |
| E-mail address: | DPenn@traders.com |
Traders' Resource Links | |
| Charting the Stock Market: The Wyckoff Method -- Books | |
| Working-Money.com -- Online Trading Services | |
| Traders.com Advantage -- Online Trading Services | |
| Technical Analysis of Stocks & Commodities -- Publications and Newsletters | |
| Working Money, at Working-Money.com -- Publications and Newsletters | |
| Traders.com Advantage -- Publications and Newsletters | |
| Professional Traders Starter Kit -- Software | |
Click here for more information about our publications!
Comments
Date: 06/25/05Rank: 3Comment:
Date: 06/29/05Rank: 5Comment:
Date: 07/05/05Rank: 4Comment:

Request Information From Our Sponsors
- VectorVest, Inc.
- Executive Premier Workshop
- One-Day Options Course
- OptionsPro
- Retirement Income Workshop
- Sure-Fire Trading Systems (VectorVest, Inc.)
- Trading as a Business Workshop
- VectorVest 7 EOD
- VectorVest 7 RealTime/IntraDay
- VectorVest AutoTester
- VectorVest Educational Services
- VectorVest OnLine
- VectorVest Options Analyzer
- VectorVest ProGraphics v6.0
- VectorVest ProTrader 7
- VectorVest RealTime Derby Tool
- VectorVest Simulator
- VectorVest Variator
- VectorVest Watchdog
- StockCharts.com, Inc.
- Candle Patterns
- Candlestick Charting Explained
- Intermarket Technical Analysis
- John Murphy on Chart Analysis
- John Murphy's Chart Pattern Recognition
- John Murphy's Market Message
- MurphyExplainsMarketAnalysis-Intermarket Analysis
- MurphyExplainsMarketAnalysis-Visual Analysis
- StockCharts.com
- Technical Analysis of the Financial Markets
- The Visual Investor
