HOT TOPICS LIST
- MACD
- Fibonacci
- RSI
- Gann
- ADXR
- Stochastics
- Volume
- Triangles
- Futures
- Cycles
- Volatility
- ZIGZAG
- MESA
- Retracement
- Aroon
INDICATORS LIST
LIST OF TOPICS
PRINT THIS ARTICLE
by Arthur Hill
NASDAQ has traded flat in June, and this consolidation looks like a bullish continuation pattern--or two.
Position: Accumulate
Arthur Hill
Arthur Hill is currently editor of TDTrader.com, a website specializing in trading strategies, sector/industry specific breadth stats and overall technical analysis. He passed the Society of Technical Analysts (STA London) diploma exam with distinction is a Certified Financial Technician (CFTe). Prior to TD Trader, he was the Chief Technical Analyst for Stockcharts.com and the main contributor to the ChartSchool.
PRINT THIS ARTICLE
CUP WITH HANDLE
NASDAQ Forms Bullish Consolidation
06/23/05 08:55:23 AMby Arthur Hill
NASDAQ has traded flat in June, and this consolidation looks like a bullish continuation pattern--or two.
Position: Accumulate
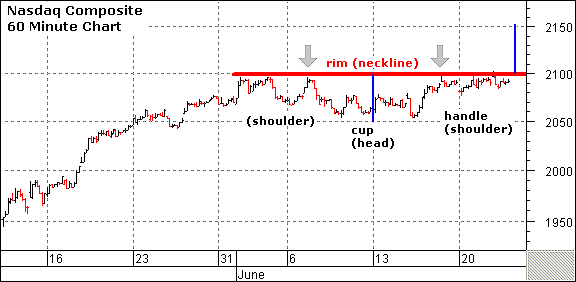
| After a sharp advance, securities require a period of rest to prepare for the next move. This rest period comes in the form of a consolidation or trading range. This provides a chance to digest recent gains and alleviate overbought conditions. On the 60-minute NASDAQ chart (Figure 1), the index has consolidated and sports two bullish patterns: a head-and-shoulders and a cup-with-handle. |
| The head-and-shoulders formed during June with the left shoulder early on, the head mid-month and the right shoulder over the last few days. Neckline resistance is set at 2100 and a move above this level would signal a continuation higher. |

|
| Figure 1: NASDAQ 60-minute chart |
| Graphic provided by: MetaStock. |
| Graphic provided by: Data eSignal. |
| |
| The cup-with-handle pattern shares 2/3 of the head-and-shoulders structure. The head marks the bottom of the bowl and the right shoulder forms the handle. As with the head-and-shoulders pattern, a move above 2100 would signal a continuation higher. |
| Resistance at 2100 marks the neckline of the head-and-shoulders and rim of the cup-with-handle. As noted, this level holds the key. A breakout would project further strength to around 2150. The distance from the neckline to the top of the head is added to the breakout for a projection. A move below the shoulder or handle low (2076) would call this bullish pattern into question. |
Arthur Hill is currently editor of TDTrader.com, a website specializing in trading strategies, sector/industry specific breadth stats and overall technical analysis. He passed the Society of Technical Analysts (STA London) diploma exam with distinction is a Certified Financial Technician (CFTe). Prior to TD Trader, he was the Chief Technical Analyst for Stockcharts.com and the main contributor to the ChartSchool.
| Title: | Editor |
| Company: | TDTrader.com |
| Address: | Willem Geetsstraat 17 |
| Mechelen, B2800 | |
| Phone # for sales: | 3215345465 |
| Website: | www.tdtrader.com |
| E-mail address: | arthurh@tdtrader.com |
Traders' Resource Links | |
| TDTrader.com has not added any product or service information to TRADERS' RESOURCE. | |
Click here for more information about our publications!
Comments
Date: 06/25/05Rank: 5Comment:
Date: 07/05/05Rank: 3Comment:

Request Information From Our Sponsors
- StockCharts.com, Inc.
- Candle Patterns
- Candlestick Charting Explained
- Intermarket Technical Analysis
- John Murphy on Chart Analysis
- John Murphy's Chart Pattern Recognition
- John Murphy's Market Message
- MurphyExplainsMarketAnalysis-Intermarket Analysis
- MurphyExplainsMarketAnalysis-Visual Analysis
- StockCharts.com
- Technical Analysis of the Financial Markets
- The Visual Investor
- VectorVest, Inc.
- Executive Premier Workshop
- One-Day Options Course
- OptionsPro
- Retirement Income Workshop
- Sure-Fire Trading Systems (VectorVest, Inc.)
- Trading as a Business Workshop
- VectorVest 7 EOD
- VectorVest 7 RealTime/IntraDay
- VectorVest AutoTester
- VectorVest Educational Services
- VectorVest OnLine
- VectorVest Options Analyzer
- VectorVest ProGraphics v6.0
- VectorVest ProTrader 7
- VectorVest RealTime Derby Tool
- VectorVest Simulator
- VectorVest Variator
- VectorVest Watchdog
