HOT TOPICS LIST
- MACD
- Fibonacci
- RSI
- Gann
- ADXR
- Stochastics
- Volume
- Triangles
- Futures
- Cycles
- Volatility
- ZIGZAG
- MESA
- Retracement
- Aroon
INDICATORS LIST
LIST OF TOPICS
PRINT THIS ARTICLE
by David Penn
Are moving average convergence/divergence histograms in the major averages warning that the rally is ready to roll over?
Position: N/A
David Penn
Technical Writer for Technical Analysis of STOCKS & COMMODITIES magazine, Working-Money.com, and Traders.com Advantage.
PRINT THIS ARTICLE
MACD
Big Trouble In Little Histograms
06/24/05 08:23:24 AMby David Penn
Are moving average convergence/divergence histograms in the major averages warning that the rally is ready to roll over?
Position: N/A
| I've been wildly waving my freak flag for moving average convergence/divergence histograms (MACDH) for months going on years now. And while there are advocates of moving averages, and magnanimous defenders of the MACD, you'll find no greater hero of the moving average convergence/divergence histogram than yours truly. |
| Like the best of technical tools, a part of what makes the histogram so useful is its relatively broad applicability. For example, I use a shift or reversal in the MACDH--a series of rising histogram bars interrupted by a falling bar or a series of falling histogram bars interrupted by a rising bar--as a signal that a potentially important price move has occurred. |

|
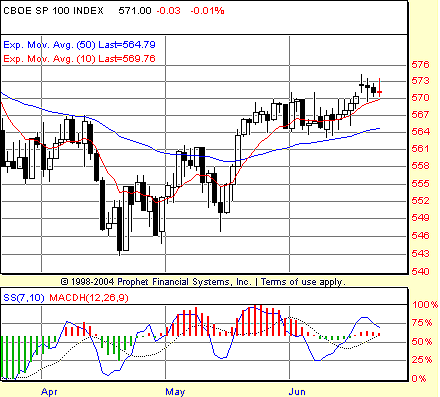
| Figure 1: The low positive readings in the moving average convergence divergence histogram (MACDH) in June suggest a waning of bullish momentum. In concert with other technical factors, this is a warning that the $OEX is vulnerable to a correction or even reversal. |
| Graphic provided by: Prophet Financial, Inc. |
| |
| There are other uses of the MACDH. Some simply use a series of rising bars as an indication of general bullish strength, with a series of falling bars a sign of generally bearish weakness. Others look for divergences between peaks and troughs in the histogram and peaks and troughs in price action. And while I am more comfortable--at least with time frames of a day or shorter--using tools like the 7,10 stochastic for spotting divergences, there is an aspect of histogram "divergences" that are worthwhile. |
| The Standard & Poor's 100 ($OEX) affords an opportunity to show what I mean. From the end of May going into June, the $OEX developed a negative stochastic divergence. This generally suggests an opportunity on the short side. However, note the fact that the histogram (in red) remained strongly positive. I've learned--from a recent attempt to short the QQQQ--that in such situations the market is still too bullish to be easily faded. Instead, it can be better to wait for a weakly positive MACDH, which indicates waning strength on the part of the bulls. Should this weakly positive MACDH arrive with other bearish and/or reversal-oriented technical signs--shooting star or bearish engulfing Japanese candlesticks, 2B tops, negative stochastic divergences--well, then, so much the better for the bearish bet. |
| In the present case of the $OEX, we have at least one of those technical signs--namely, the month-on-month negative stochastic divergence--accompanying a weakly positive MACD histogram. While there is of course no guarantee that the $OEX is poised to reverse, the odds of it doing so are greater, given this confluence of technical factors that it might have been during the previous reversal opportunity with the negative stochastic divergence in early June. |
Technical Writer for Technical Analysis of STOCKS & COMMODITIES magazine, Working-Money.com, and Traders.com Advantage.
| Title: | Technical Writer |
| Company: | Technical Analysis, Inc. |
| Address: | 4757 California Avenue SW |
| Seattle, WA 98116 | |
| Phone # for sales: | 206 938 0570 |
| Fax: | 206 938 1307 |
| Website: | www.Traders.com |
| E-mail address: | DPenn@traders.com |
Traders' Resource Links | |
| Charting the Stock Market: The Wyckoff Method -- Books | |
| Working-Money.com -- Online Trading Services | |
| Traders.com Advantage -- Online Trading Services | |
| Technical Analysis of Stocks & Commodities -- Publications and Newsletters | |
| Working Money, at Working-Money.com -- Publications and Newsletters | |
| Traders.com Advantage -- Publications and Newsletters | |
| Professional Traders Starter Kit -- Software | |
Click here for more information about our publications!
Comments
Date: 06/25/05Rank: 3Comment:
Date: 06/29/05Rank: 5Comment:
Date: 07/05/05Rank: 5Comment:
Date: 07/07/05Rank: 4Comment:

Request Information From Our Sponsors
- VectorVest, Inc.
- Executive Premier Workshop
- One-Day Options Course
- OptionsPro
- Retirement Income Workshop
- Sure-Fire Trading Systems (VectorVest, Inc.)
- Trading as a Business Workshop
- VectorVest 7 EOD
- VectorVest 7 RealTime/IntraDay
- VectorVest AutoTester
- VectorVest Educational Services
- VectorVest OnLine
- VectorVest Options Analyzer
- VectorVest ProGraphics v6.0
- VectorVest ProTrader 7
- VectorVest RealTime Derby Tool
- VectorVest Simulator
- VectorVest Variator
- VectorVest Watchdog
- StockCharts.com, Inc.
- Candle Patterns
- Candlestick Charting Explained
- Intermarket Technical Analysis
- John Murphy on Chart Analysis
- John Murphy's Chart Pattern Recognition
- John Murphy's Market Message
- MurphyExplainsMarketAnalysis-Intermarket Analysis
- MurphyExplainsMarketAnalysis-Visual Analysis
- StockCharts.com
- Technical Analysis of the Financial Markets
- The Visual Investor
