HOT TOPICS LIST
- MACD
- Fibonacci
- RSI
- Gann
- ADXR
- Stochastics
- Volume
- Triangles
- Futures
- Cycles
- Volatility
- ZIGZAG
- MESA
- Retracement
- Aroon
INDICATORS LIST
LIST OF TOPICS
PRINT THIS ARTICLE
by Koos van der Merwe
With the price of gold looking interesting again, here is a share worth watching.
Position: Buy
Koos van der Merwe
Has been a technical analyst since 1969, and has worked as a futures and options trader with First Financial Futures in Johannesburg, South Africa.
PRINT THIS ARTICLE
ELLIOTT WAVE
Bema Gold
06/24/05 10:33:32 AMby Koos van der Merwe
With the price of gold looking interesting again, here is a share worth watching.
Position: Buy
| Bema Gold Corp. is an intermediate gold producer with mines and development projects in Russia, Chile, and South Africa. The company is one of the world's fastest-growing gold producers with potential production of one million ounces of gold annually by 2009. This is what the company website says, but what do the charts of the company tell us? |

|
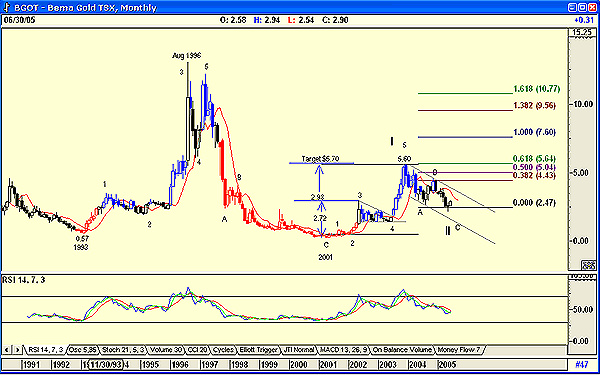
| Figure 1: Bema Gold monthly chart |
| Graphic provided by: AdvancedGET. |
| |
| Figure 1 is a monthly chart showing how the price moved from a low of $0.57 in 1993 to a high of $13.05 in August 1996, a very good return in a stagnant gold market, but then, after a double top, there was a painful collapse to a low of $0.26. The share price then rose in an impulse wave, forming a cup and handle formation, with the handle at $2.98. The target for the formation is $5.70 (2.98 - 0.26 = 2.72 + 2.98 = 5.70), and after forming a consolidation triangle, which, incidentally,would have tipped us off to an early buy as the price broke out of the triangle, the price rose to $5.60 by January 2004. I have shown a wave count that suggests that the recent fall in price to $2.18 is a wave II on the monthly chart. Should the price complete wave II at present levels, the target for wave III according to Fibonacci extensions would be $7.51 (1), $9.53 (1.382) and $10.78 (1.618). I must stress that these targets are only in place if the price turns upward from present levels. To fine tune our analysis, we now turn to a daily chart (Figure 2). |

|
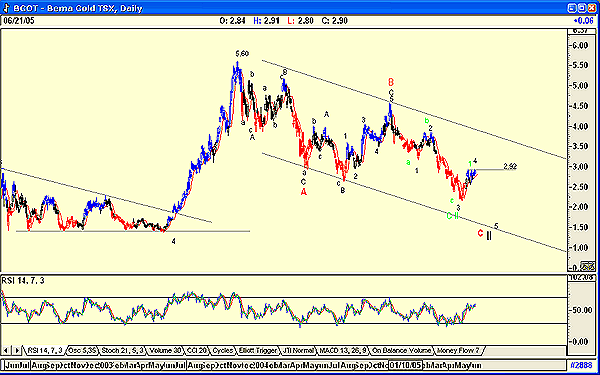
| Figure 2: Bema Gold daily chart |
| Graphic provided by: AdvancedGET. |
| |
| Figure 2 suggests that there is still some downside to the share price before the move up. This is assuming that the C-wave of what appears to be a complicated wave II is a five-impulse wave. I must assume, however, because the C-wave could turn into an a-b-c retracement, which would mean that wave II is complete, and the share price has completed a wave 1 and is now in a wave 2 of wave III upward. Complicated? But of course--Elliot wave analysis was never meant to be easy. I have shown the alternate count in green on the chart. What would lead me to consider the alternate count would be a break above the strong resistance level that has formed at the pivot point of $2.92. Finally, do note the relative strength index (RSI), which is bullish. |
| Whatever the true count, Bema Gold is a share we could purchase at present levels. The time held may differ, and the drawdown could be more than we would like, but the ultimate return would be worth the risk. |
Has been a technical analyst since 1969, and has worked as a futures and options trader with First Financial Futures in Johannesburg, South Africa.
| Address: | 3256 West 24th Ave |
| Vancouver, BC | |
| Phone # for sales: | 6042634214 |
| E-mail address: | petroosp@gmail.com |
Click here for more information about our publications!
Comments
Date: 06/25/05Rank: 3Comment:

Request Information From Our Sponsors
- StockCharts.com, Inc.
- Candle Patterns
- Candlestick Charting Explained
- Intermarket Technical Analysis
- John Murphy on Chart Analysis
- John Murphy's Chart Pattern Recognition
- John Murphy's Market Message
- MurphyExplainsMarketAnalysis-Intermarket Analysis
- MurphyExplainsMarketAnalysis-Visual Analysis
- StockCharts.com
- Technical Analysis of the Financial Markets
- The Visual Investor
- VectorVest, Inc.
- Executive Premier Workshop
- One-Day Options Course
- OptionsPro
- Retirement Income Workshop
- Sure-Fire Trading Systems (VectorVest, Inc.)
- Trading as a Business Workshop
- VectorVest 7 EOD
- VectorVest 7 RealTime/IntraDay
- VectorVest AutoTester
- VectorVest Educational Services
- VectorVest OnLine
- VectorVest Options Analyzer
- VectorVest ProGraphics v6.0
- VectorVest ProTrader 7
- VectorVest RealTime Derby Tool
- VectorVest Simulator
- VectorVest Variator
- VectorVest Watchdog
