HOT TOPICS LIST
- MACD
- Fibonacci
- RSI
- Gann
- ADXR
- Stochastics
- Volume
- Triangles
- Futures
- Cycles
- Volatility
- ZIGZAG
- MESA
- Retracement
- Aroon
INDICATORS LIST
LIST OF TOPICS
PRINT THIS ARTICLE
by Dennis D. Peterson
On-balance volume and money flow are two commonly used indicators. Understanding how to use them can provide additional confirmation of a pattern.
Position: N/A
Dennis D. Peterson
Market index trading on a daily basis.
PRINT THIS ARTICLE
ON BALANCE VOLUME
Bowl Pattern Confirmation
07/17/00 08:32:15 AMby Dennis D. Peterson
On-balance volume and money flow are two commonly used indicators. Understanding how to use them can provide additional confirmation of a pattern.
Position: N/A
| In my last posting I cited on-balance volume (OBV) and money flow (MF) as having confirming trends for a reversal pattern. On-balance volume is a measure of whether money is flowing into or out of a security. If the security closes higher than the day before then all of the volume is added to the previous sum. If it closes lower then the volume is subtracted, giving you a running total. It answers the question that -- on balance-- has money moved in or out as far as volume is concerned? |
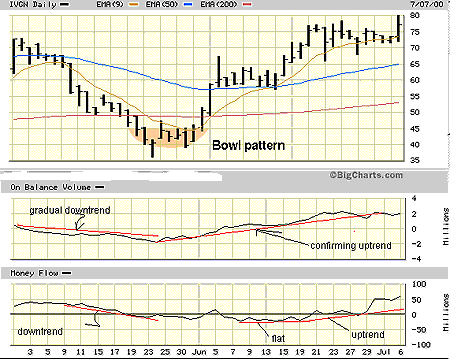
| When using a leading indicator, such as the OBV and MF, you should focus on their trendlines. Shown in Figure 1 is the OBV, and its trendline clearly predicts an upward move for the right side of the bowl. A downtrend is seen in the left side of the bowl. The fact that both the OBV uptrend and downtrend have a shallow slope confirms a bowl pattern. |

|
| |
| I also used the money flow indicator. The MF is a cumulative total of the change in today's closing price minus yesterday's close, multiplied by the volume. If today's close is higher than yesterday's, a positive value is added. And if it is less that yesterday's close, a negative value is added. This daily running total also gives a measure of whether money is flowing in or out of a security. Again, we look at the trend to see if we have confirmation. In Figure 1 we can see the flattening, from June 8th through June 21, in the MF trend that warns us of a potential divergence. |
| The price action follows both of the trends. From the OBV an overall uptrend is seen, and from the MF we see that the uptrend will have some hesitation. |
Market index trading on a daily basis.
| Title: | Staff Writer |
| Company: | Technical Analysis, Inc. |
| Address: | 4757 California Ave SW |
| Seattle, WA 98116-4499 | |
| Phone # for sales: | 206 938 0570 |
| Fax: | 206 938 1307 |
| Website: | www.traders.com |
| E-mail address: | dpeterson@traders.com |
Traders' Resource Links | |
| Charting the Stock Market: The Wyckoff Method -- Books | |
| Working-Money.com -- Online Trading Services | |
| Traders.com Advantage -- Online Trading Services | |
| Technical Analysis of Stocks & Commodities -- Publications and Newsletters | |
| Working Money, at Working-Money.com -- Publications and Newsletters | |
| Traders.com Advantage -- Publications and Newsletters | |
| Professional Traders Starter Kit -- Software | |
Click here for more information about our publications!
Comments
Date: / /Rank: 4Comment:

Request Information From Our Sponsors
- StockCharts.com, Inc.
- Candle Patterns
- Candlestick Charting Explained
- Intermarket Technical Analysis
- John Murphy on Chart Analysis
- John Murphy's Chart Pattern Recognition
- John Murphy's Market Message
- MurphyExplainsMarketAnalysis-Intermarket Analysis
- MurphyExplainsMarketAnalysis-Visual Analysis
- StockCharts.com
- Technical Analysis of the Financial Markets
- The Visual Investor
- VectorVest, Inc.
- Executive Premier Workshop
- One-Day Options Course
- OptionsPro
- Retirement Income Workshop
- Sure-Fire Trading Systems (VectorVest, Inc.)
- Trading as a Business Workshop
- VectorVest 7 EOD
- VectorVest 7 RealTime/IntraDay
- VectorVest AutoTester
- VectorVest Educational Services
- VectorVest OnLine
- VectorVest Options Analyzer
- VectorVest ProGraphics v6.0
- VectorVest ProTrader 7
- VectorVest RealTime Derby Tool
- VectorVest Simulator
- VectorVest Variator
- VectorVest Watchdog
