HOT TOPICS LIST
- MACD
- Fibonacci
- RSI
- Gann
- ADXR
- Stochastics
- Volume
- Triangles
- Futures
- Cycles
- Volatility
- ZIGZAG
- MESA
- Retracement
- Aroon
INDICATORS LIST
LIST OF TOPICS
PRINT THIS ARTICLE
by Luis Ferro
Following an uptrend that started in January 2003, Toys R Us entered a narrow trading range. The formation of a Bollinger Band pattern known as the "squeeze" suggests that a sharp directional movement is likely to occur, and further analysis leads to the conclusion that the direction will probably be up.
Position: Buy
Luis Ferro
Trader and technical analyst living in Bern, Switzerland. A full member of the STA, currently enrolled in the DITA program and the CMT program.
PRINT THIS ARTICLE
BOLLINGER BANDS
The Squeeze For Toys R Us
06/23/05 08:23:37 AMby Luis Ferro
Following an uptrend that started in January 2003, Toys R Us entered a narrow trading range. The formation of a Bollinger Band pattern known as the "squeeze" suggests that a sharp directional movement is likely to occur, and further analysis leads to the conclusion that the direction will probably be up.
Position: Buy
| TOY reversed the long-term downtrend in January 2003 and was able to break through an important resistance level--14.5--in February 2004. After a pullback to this level, the stock rallied to 26, a level where it found strong resistance. In the final stage of this uptrend, there was a strong upward thrust with the formation of two successive gaps, which were accompanied by very high volume. At first sight, it appeared to be an exhaustion movement, typical of an overextended stock, and we could have anticipated a short-/medium-term correction. Instead, the gaps remained unfilled and the stock entered a narrow trading range. |

|
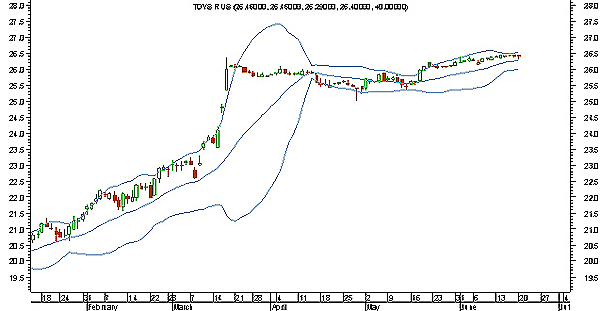
| Figure 1: Daily chart of TOY with Bollinger Bands |
| Graphic provided by: MetaStock. |
| |
| In the daily chart (Figure 1), it is possible to see the behavior of the Bollinger Bands (BB) during this consolidation period. Due to a strong decrease in volatility, the Bollinger Bands contracted sharply, a pattern that is known as the "squeeze." John Bollinger, the creator of the bands that carry his name, calls this pattern the most significant characteristic of BB, because most of the time this sharp contraction of the bands is followed by a very strong directional movement. The direction is difficult to predict, and Bollinger recommends that indicators (especially volume-based indicators) be used and warns that the initial breakout is not always in the same direction of the final movement. |

|
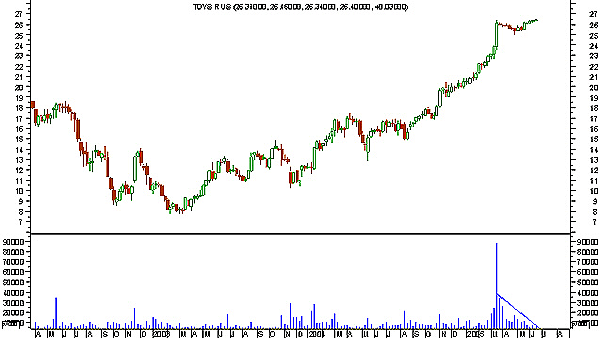
| Figure 2: Weekly chart of TOY showing the volume decrease |
| Graphic provided by: MetaStock. |
| |
| In the weekly chart (Figure 2), it is clear the volume evolution along the trading range. The decrease in volume is the normal pattern in any countertrend movement or consolidation that is expected to break in the direction of the previous trend, and implies that the previous uptrend is likely to continue. |

|
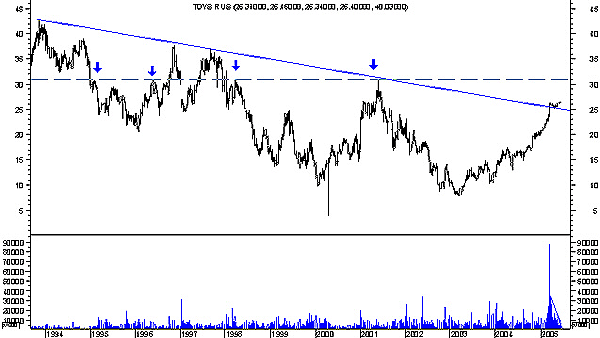
| Figure 3: Weekly chart of TOY showing important support/resistance levels |
| Graphic provided by: MetaStock. |
| |
| Of note is also the break of TOY above the down trendline, connecting the peaks of the previous longer-term downtrend. When prices made a pullback to the trendline it acted as support, and this role reversal is an indication of strength for the current uptrend (Figure 3). |
| The long-term support and resistance levels are also clearly visible in the weekly chart. While the previous resistance level of 26 is significant, the most important support/resistance level is at 31 because this level has acted as support/resistance more times than any other. This is the logical target if the stock breaks upward and it should be used when calculating the risk/reward relation for trading TOY. |
Trader and technical analyst living in Bern, Switzerland. A full member of the STA, currently enrolled in the DITA program and the CMT program.
| Address: | Switzerland |
| E-mail address: | luispgsf@yahoo.com |
Click here for more information about our publications!
Comments
Date: 06/25/05Rank: 4Comment:

Request Information From Our Sponsors
- StockCharts.com, Inc.
- Candle Patterns
- Candlestick Charting Explained
- Intermarket Technical Analysis
- John Murphy on Chart Analysis
- John Murphy's Chart Pattern Recognition
- John Murphy's Market Message
- MurphyExplainsMarketAnalysis-Intermarket Analysis
- MurphyExplainsMarketAnalysis-Visual Analysis
- StockCharts.com
- Technical Analysis of the Financial Markets
- The Visual Investor
- VectorVest, Inc.
- Executive Premier Workshop
- One-Day Options Course
- OptionsPro
- Retirement Income Workshop
- Sure-Fire Trading Systems (VectorVest, Inc.)
- Trading as a Business Workshop
- VectorVest 7 EOD
- VectorVest 7 RealTime/IntraDay
- VectorVest AutoTester
- VectorVest Educational Services
- VectorVest OnLine
- VectorVest Options Analyzer
- VectorVest ProGraphics v6.0
- VectorVest ProTrader 7
- VectorVest RealTime Derby Tool
- VectorVest Simulator
- VectorVest Variator
- VectorVest Watchdog
