HOT TOPICS LIST
- MACD
- Fibonacci
- RSI
- Gann
- ADXR
- Stochastics
- Volume
- Triangles
- Futures
- Cycles
- Volatility
- ZIGZAG
- MESA
- Retracement
- Aroon
INDICATORS LIST
LIST OF TOPICS
PRINT THIS ARTICLE
by Arthur Hill
Weak relative strength and a new low in on-balance volume point to a support break in Xilinx.
Position: Sell
Arthur Hill
Arthur Hill is currently editor of TDTrader.com, a website specializing in trading strategies, sector/industry specific breadth stats and overall technical analysis. He passed the Society of Technical Analysts (STA London) diploma exam with distinction is a Certified Financial Technician (CFTe). Prior to TD Trader, he was the Chief Technical Analyst for Stockcharts.com and the main contributor to the ChartSchool.
PRINT THIS ARTICLE
DESCENDING TRIANGLES
Xilinx Testing Critical Support
06/22/05 07:41:18 AMby Arthur Hill
Weak relative strength and a new low in on-balance volume point to a support break in Xilinx.
Position: Sell
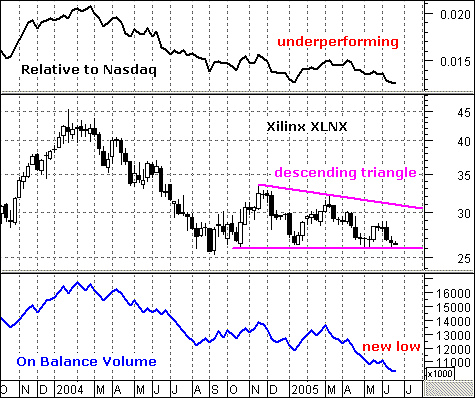
| The price relative measures the performance of one security against another. In this case, I am comparing the performance of XLNX against the NASDAQ. The price relative rises when XLNX outperforms the NASDAQ and declines when XLNX underperforms. The price relative peaked in February 2004 and declined for a year. There was a bounce in early 2005, but the indicator is testing its low again and the stock shows relative weakness. This is bearish. |

|
| Figure 1: XLNX |
| Graphic provided by: MetaStock. |
| Graphic provided by: Reuters. |
| |
| On-balance volume (OBV) moved to a new low as selling pressure remains strong (Figure 1). Technical analyst Joseph Granville theorized that volume precedes price and the new low in OBV points to further weakness in the stock. Note that the stock is testing support around 26 and has yet to make a new low. OBV is leading the way and price is likely to follow. |
| Even the price chart sports a bearish pattern. After a sharp decline in 2004, the stock consolidated in 2005 and formed a descending triangle. These are bearish continuation patterns, and a move below 26 would provide confirmation. The lower highs show selling pressure at lower and lower levels. The equal lows show the demand line. Once the demand line is broken, supply takes over and pushes prices lower. Upon a support break at 26, the downside target would be to around 19 (33 - 26 = 7, 26 - 7 = 19). Only a break above the June high (29) would negate this bearish setup. |
Arthur Hill is currently editor of TDTrader.com, a website specializing in trading strategies, sector/industry specific breadth stats and overall technical analysis. He passed the Society of Technical Analysts (STA London) diploma exam with distinction is a Certified Financial Technician (CFTe). Prior to TD Trader, he was the Chief Technical Analyst for Stockcharts.com and the main contributor to the ChartSchool.
| Title: | Editor |
| Company: | TDTrader.com |
| Address: | Willem Geetsstraat 17 |
| Mechelen, B2800 | |
| Phone # for sales: | 3215345465 |
| Website: | www.tdtrader.com |
| E-mail address: | arthurh@tdtrader.com |
Traders' Resource Links | |
| TDTrader.com has not added any product or service information to TRADERS' RESOURCE. | |
Click here for more information about our publications!
Comments
Date: 06/22/05Rank: 4Comment:
Date: 06/23/05Rank: 4Comment:

Request Information From Our Sponsors
- StockCharts.com, Inc.
- Candle Patterns
- Candlestick Charting Explained
- Intermarket Technical Analysis
- John Murphy on Chart Analysis
- John Murphy's Chart Pattern Recognition
- John Murphy's Market Message
- MurphyExplainsMarketAnalysis-Intermarket Analysis
- MurphyExplainsMarketAnalysis-Visual Analysis
- StockCharts.com
- Technical Analysis of the Financial Markets
- The Visual Investor
- VectorVest, Inc.
- Executive Premier Workshop
- One-Day Options Course
- OptionsPro
- Retirement Income Workshop
- Sure-Fire Trading Systems (VectorVest, Inc.)
- Trading as a Business Workshop
- VectorVest 7 EOD
- VectorVest 7 RealTime/IntraDay
- VectorVest AutoTester
- VectorVest Educational Services
- VectorVest OnLine
- VectorVest Options Analyzer
- VectorVest ProGraphics v6.0
- VectorVest ProTrader 7
- VectorVest RealTime Derby Tool
- VectorVest Simulator
- VectorVest Variator
- VectorVest Watchdog
