HOT TOPICS LIST
- MACD
- Fibonacci
- RSI
- Gann
- ADXR
- Stochastics
- Volume
- Triangles
- Futures
- Cycles
- Volatility
- ZIGZAG
- MESA
- Retracement
- Aroon
INDICATORS LIST
LIST OF TOPICS
PRINT THIS ARTICLE
by Arthur Hill
Nvdia has been a stellar performer since August, but a potential double top and bearish engulfing pattern could mark the end of the run.
Position: Sell
Arthur Hill
Arthur Hill is currently editor of TDTrader.com, a website specializing in trading strategies, sector/industry specific breadth stats and overall technical analysis. He passed the Society of Technical Analysts (STA London) diploma exam with distinction is a Certified Financial Technician (CFTe). Prior to TD Trader, he was the Chief Technical Analyst for Stockcharts.com and the main contributor to the ChartSchool.
PRINT THIS ARTICLE
DOUBLE TOPS
Nvdia Trying To Reverse At Resistance
06/22/05 07:33:49 AMby Arthur Hill
Nvdia has been a stellar performer since August, but a potential double top and bearish engulfing pattern could mark the end of the run.
Position: Sell
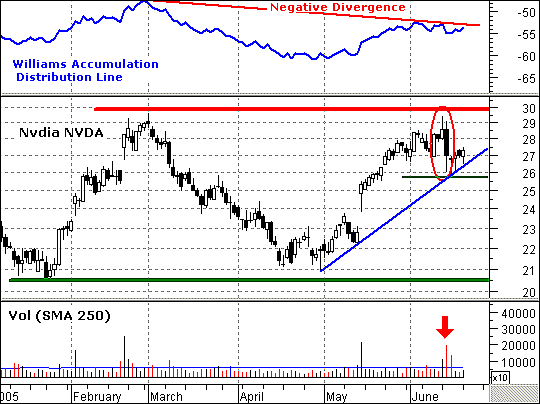
| Nvdia advanced from 10 to 30 (August to March) and then declined to around 21. The nine-point decline marked a retracement that was around 50% of the prior advance. The stock bottomed in late April and raced back to its March high over the last seven to eight weeks. With relatively equal highs just below 30, the prospects of a double top are emerging. |
| A bearish candlestick reversal and key volume indicator reinforce the notion of a double top. First, the index formed a bearish engulfing on high volume last week (red oval). NVDA managed to consolidate the last four days, but a move below the June low would confirm the bearish engulfing. Second, the Williams accumulation/ distribution line formed a low high in June. The stock also formed a lower high, but the June high came pretty close to the March high. In contrast, the indicator called for a significantly lower high, so I would call this a negative divergence (Figure 1). |

|
| Figure 1: NVDA negative divergence |
| Graphic provided by: MetaStock. |
| Graphic provided by: Reuters Data. |
| |
| A double top would not be confirmed unless the stock breaks support at 20. Based on traditional technical analysis measurement, a move below 20 would project further weakness to around 10, which is where the advance began in August (30 - 20 = 10, 20 - 10 = 10). For now, I would watch the June low and turn short-term bearish on a move below 25.75. |
Arthur Hill is currently editor of TDTrader.com, a website specializing in trading strategies, sector/industry specific breadth stats and overall technical analysis. He passed the Society of Technical Analysts (STA London) diploma exam with distinction is a Certified Financial Technician (CFTe). Prior to TD Trader, he was the Chief Technical Analyst for Stockcharts.com and the main contributor to the ChartSchool.
| Title: | Editor |
| Company: | TDTrader.com |
| Address: | Willem Geetsstraat 17 |
| Mechelen, B2800 | |
| Phone # for sales: | 3215345465 |
| Website: | www.tdtrader.com |
| E-mail address: | arthurh@tdtrader.com |
Traders' Resource Links | |
| TDTrader.com has not added any product or service information to TRADERS' RESOURCE. | |
Click here for more information about our publications!
Comments
Date: 06/22/05Rank: 4Comment:

Request Information From Our Sponsors
- StockCharts.com, Inc.
- Candle Patterns
- Candlestick Charting Explained
- Intermarket Technical Analysis
- John Murphy on Chart Analysis
- John Murphy's Chart Pattern Recognition
- John Murphy's Market Message
- MurphyExplainsMarketAnalysis-Intermarket Analysis
- MurphyExplainsMarketAnalysis-Visual Analysis
- StockCharts.com
- Technical Analysis of the Financial Markets
- The Visual Investor
- VectorVest, Inc.
- Executive Premier Workshop
- One-Day Options Course
- OptionsPro
- Retirement Income Workshop
- Sure-Fire Trading Systems (VectorVest, Inc.)
- Trading as a Business Workshop
- VectorVest 7 EOD
- VectorVest 7 RealTime/IntraDay
- VectorVest AutoTester
- VectorVest Educational Services
- VectorVest OnLine
- VectorVest Options Analyzer
- VectorVest ProGraphics v6.0
- VectorVest ProTrader 7
- VectorVest RealTime Derby Tool
- VectorVest Simulator
- VectorVest Variator
- VectorVest Watchdog
