HOT TOPICS LIST
- MACD
- Fibonacci
- RSI
- Gann
- ADXR
- Stochastics
- Volume
- Triangles
- Futures
- Cycles
- Volatility
- ZIGZAG
- MESA
- Retracement
- Aroon
INDICATORS LIST
LIST OF TOPICS
PRINT THIS ARTICLE
by David Penn
When a breakdown from a bear flag failed to reach its objective, prices bounced their way into a triangular consolidation.
Position: N/A
David Penn
Technical Writer for Technical Analysis of STOCKS & COMMODITIES magazine, Working-Money.com, and Traders.com Advantage.
PRINT THIS ARTICLE
TRIANGLES
September Coffee's Symmetrical Triangle
06/21/05 08:01:34 AMby David Penn
When a breakdown from a bear flag failed to reach its objective, prices bounced their way into a triangular consolidation.
Position: N/A
| A little over two months ago, I wrote about the fortunes of coffee futures. At the time ("Coffee's Bear Flag," Traders.com Advantage, April 12, 2005), coffee futures were breaking down below their 50-day exponential moving average (EMA), courtesy of the downside of a bearish flag pattern. |
| Given the measurement rules applicable to flag patterns, I suggested that coffee futures (basis May) would probably fall at least to 110. Again, basis May, coffee did that much but little more, as the futures registered a low of 109.75 on April 15. |

|
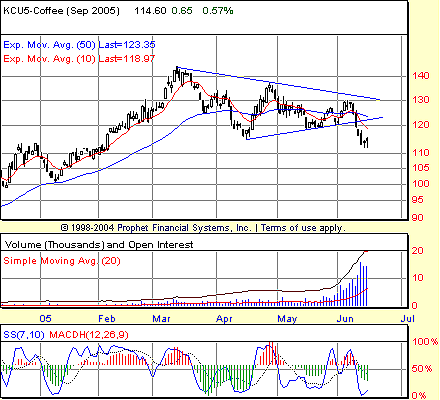
| Figure 1: The breakdown from this symmetrical triangle suggests a downside that will bring coffee back from "dollars" to "cents." |
| Graphic provided by: Prophet Financial, Inc. |
| |
| Using September futures in Figure 1, we can see that when the breakdown from the bear flag ended, prices rallied back above the 50-day EMA in April--only to fall back below that level in May. June found September coffee back above the 50-day period early in the month, yet as the days work toward mid-month, coffee futures were fading once again. |
| This sort of back-and-forth movement, involving lower highs and higher lows, created a symmetrical triangle pattern. Contracting triangle patterns--whether they are symmetrical, ascending, or descending--tend to lead to explosive price moves, in part because the price contraction that occurs as these patterns develop compresses volatility below its usual, or historical, norm. Eventually, prices will tend to revert to their historic volatility, and that process of "reversion to the mean" is what leads to the often-dramatic breakout or breakdown. |
| What can traders look for in the way of a breakdown from this triangle? At the formation's widest point, the triangle measures some 25 points from top to bottom. Subtracting that amount from the value at the breakdown (approximately 120), traders should look for a downside move into the 95-cent area. |
Technical Writer for Technical Analysis of STOCKS & COMMODITIES magazine, Working-Money.com, and Traders.com Advantage.
| Title: | Technical Writer |
| Company: | Technical Analysis, Inc. |
| Address: | 4757 California Avenue SW |
| Seattle, WA 98116 | |
| Phone # for sales: | 206 938 0570 |
| Fax: | 206 938 1307 |
| Website: | www.Traders.com |
| E-mail address: | DPenn@traders.com |
Traders' Resource Links | |
| Charting the Stock Market: The Wyckoff Method -- Books | |
| Working-Money.com -- Online Trading Services | |
| Traders.com Advantage -- Online Trading Services | |
| Technical Analysis of Stocks & Commodities -- Publications and Newsletters | |
| Working Money, at Working-Money.com -- Publications and Newsletters | |
| Traders.com Advantage -- Publications and Newsletters | |
| Professional Traders Starter Kit -- Software | |
Click here for more information about our publications!
Comments
Date: 06/21/05Rank: 3Comment:

Request Information From Our Sponsors
- VectorVest, Inc.
- Executive Premier Workshop
- One-Day Options Course
- OptionsPro
- Retirement Income Workshop
- Sure-Fire Trading Systems (VectorVest, Inc.)
- Trading as a Business Workshop
- VectorVest 7 EOD
- VectorVest 7 RealTime/IntraDay
- VectorVest AutoTester
- VectorVest Educational Services
- VectorVest OnLine
- VectorVest Options Analyzer
- VectorVest ProGraphics v6.0
- VectorVest ProTrader 7
- VectorVest RealTime Derby Tool
- VectorVest Simulator
- VectorVest Variator
- VectorVest Watchdog
- StockCharts.com, Inc.
- Candle Patterns
- Candlestick Charting Explained
- Intermarket Technical Analysis
- John Murphy on Chart Analysis
- John Murphy's Chart Pattern Recognition
- John Murphy's Market Message
- MurphyExplainsMarketAnalysis-Intermarket Analysis
- MurphyExplainsMarketAnalysis-Visual Analysis
- StockCharts.com
- Technical Analysis of the Financial Markets
- The Visual Investor
