HOT TOPICS LIST
- MACD
- Fibonacci
- RSI
- Gann
- ADXR
- Stochastics
- Volume
- Triangles
- Futures
- Cycles
- Volatility
- ZIGZAG
- MESA
- Retracement
- Aroon
INDICATORS LIST
LIST OF TOPICS
PRINT THIS ARTICLE
by Arthur Hill
After a big move in April and May, the software HOLDRS (SWH) corrected with a falling flag. That correction could be coming to an end.
Position: Hold
Arthur Hill
Arthur Hill is currently editor of TDTrader.com, a website specializing in trading strategies, sector/industry specific breadth stats and overall technical analysis. He passed the Society of Technical Analysts (STA London) diploma exam with distinction is a Certified Financial Technician (CFTe). Prior to TD Trader, he was the Chief Technical Analyst for Stockcharts.com and the main contributor to the ChartSchool.
PRINT THIS ARTICLE
FLAGS AND PENNANTS
Software HOLDRS Firm At Support
06/17/05 07:48:15 AMby Arthur Hill
After a big move in April and May, the software HOLDRS (SWH) corrected with a falling flag. That correction could be coming to an end.
Position: Hold
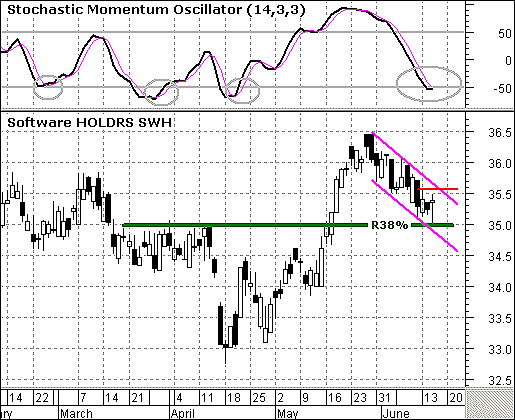
| On the price chart (Figure 1), the stock surged above resistance in mid-May with a strong move. This breakout sets the bullish tone, but also created an overbought situation. Note that the stochastic momentum oscillator moved well above 50. Before moving higher, the stock needed to alleviate this condition with a correction or a consolidation. |
| A few words about the stochastic momentum oscillator. The traditional stochastic oscillator measures the closing level relative to the high low range over a given period. The stochastic oscillator moves higher as the close reaches the high end of this range and lower as it nears the low end of the range. In contrast, the stochastic momentum oscillator measures the close relative to the midpoint of the range. Therefore, it moves higher as the close advances from the midpoint of the range and lower as it declines below the midpoint. |

|
| Figure 1: Stochastic momentum oscillator. The stock surged above resistance in mid-May with a strong move. This breakout set the bullish tone, but also created an overbought situation. |
| Graphic provided by: MetaStock. |
| Graphic provided by: Reuters Data. |
| |
| The software HOLDRS (SWH) obliged the overbought condition with a classic correction. First, the decline formed a falling flag. Second, the decline retraced a Fibonacci 38.2% level of the prior advance. And third, the stock found support near broken resistance. These characteristics are all typical for corrections, and only a bullish catalyst is needed to turn bullish again. |
| The stock has started to firm and the stochastic momentum oscillator moved to oversold. SWH formed a small white candlestick with a long lower shadow on Wednesday. This can be considered a hammer, and a move above 36.6 would confirm this bullish candlestick reversal. This would also break the upper trendline of the falling flag. The stochastic momentum oscillator moved to a level (-50) that produced bounces in the past (gray ovals). A move above the signal line could be used to confirm a breakout on the price chart. |
Arthur Hill is currently editor of TDTrader.com, a website specializing in trading strategies, sector/industry specific breadth stats and overall technical analysis. He passed the Society of Technical Analysts (STA London) diploma exam with distinction is a Certified Financial Technician (CFTe). Prior to TD Trader, he was the Chief Technical Analyst for Stockcharts.com and the main contributor to the ChartSchool.
| Title: | Editor |
| Company: | TDTrader.com |
| Address: | Willem Geetsstraat 17 |
| Mechelen, B2800 | |
| Phone # for sales: | 3215345465 |
| Website: | www.tdtrader.com |
| E-mail address: | arthurh@tdtrader.com |
Traders' Resource Links | |
| TDTrader.com has not added any product or service information to TRADERS' RESOURCE. | |
Click here for more information about our publications!
Comments
Date: 06/18/05Rank: 4Comment:

Request Information From Our Sponsors
- StockCharts.com, Inc.
- Candle Patterns
- Candlestick Charting Explained
- Intermarket Technical Analysis
- John Murphy on Chart Analysis
- John Murphy's Chart Pattern Recognition
- John Murphy's Market Message
- MurphyExplainsMarketAnalysis-Intermarket Analysis
- MurphyExplainsMarketAnalysis-Visual Analysis
- StockCharts.com
- Technical Analysis of the Financial Markets
- The Visual Investor
- VectorVest, Inc.
- Executive Premier Workshop
- One-Day Options Course
- OptionsPro
- Retirement Income Workshop
- Sure-Fire Trading Systems (VectorVest, Inc.)
- Trading as a Business Workshop
- VectorVest 7 EOD
- VectorVest 7 RealTime/IntraDay
- VectorVest AutoTester
- VectorVest Educational Services
- VectorVest OnLine
- VectorVest Options Analyzer
- VectorVest ProGraphics v6.0
- VectorVest ProTrader 7
- VectorVest RealTime Derby Tool
- VectorVest Simulator
- VectorVest Variator
- VectorVest Watchdog
