HOT TOPICS LIST
- MACD
- Fibonacci
- RSI
- Gann
- ADXR
- Stochastics
- Volume
- Triangles
- Futures
- Cycles
- Volatility
- ZIGZAG
- MESA
- Retracement
- Aroon
INDICATORS LIST
LIST OF TOPICS
PRINT THIS ARTICLE
by Han Kim
There are many reversal patterns and among them, the triangle pattern is one of the most significant. However, reversals do not always occur.
Position: N/A
Han Kim
Traders.com Advantage Staff Writer
PRINT THIS ARTICLE
TRIANGLES
The Descending Triangle
07/19/00 10:26:02 AMby Han Kim
There are many reversal patterns and among them, the triangle pattern is one of the most significant. However, reversals do not always occur.
Position: N/A
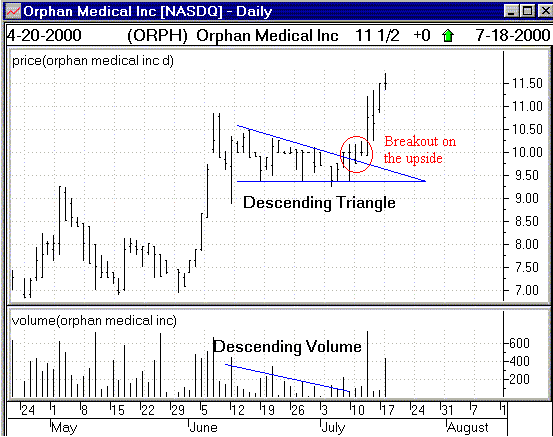
| The descending triangle can signal the reversal of an uptrend in the market being charted. It is formed when a runup in a security's price levels off and is followed by a series of lower highs and relatively equal lows. Figure 1, of Orphan Medical Inc. [ORPH], illustrates a descending triangle pattern. In the ORPH chart below, a trendline was drawn connecting the descending peaks, and another line connecting the valleys. These lines were extended to the right until they formed a descending triangle. Volume, typically heavier at the beginning of the pattern, decreases as price moves toward the apex and then increases during the breakout. |
| The minimum number of lows and highs required to form the descending triangle, or any triangle for that matter, is two of each, for a total of four. The descending triangle is referred to as a right-angle triangle because if a vertical line is drawn at the open end of the triangle, a right-angle triangle is formed. If this pattern is followed by a breakout to the downside from within the triangle formation, it would be a triangle top. Or if the price breaks out to the upside, it would become a continuation pattern rather than a reversal. |

|
| Figure 1. This descending triangle formation has a corresponding decline in volume. However, it is a continuation pattern since the breakout is to the upside. |
| Graphic provided by: Window. |
| |
| The successive lower highs forming the descending side of the triangle indicates more aggressive selling than buying. Frequently, price will break out to the downside after a number of reversals (minimum of four) within the bounds of the two trendlines. Breakouts usually occur after moving about two-thirds to three-quarters of the distance between the start of the formation and the apex, but there are exceptions. |
| It is not uncommon for prices to retrace back to the trendline after breaking out of the triangle and then reverse again, continuing in the direction of the breakout. The breakout is considered to have failed if prices move significantly back into the triangle pattern, which does happen occasionally. |
| For this particular security, the breakout was to the upside and a continuation pattern occurred instead of a reversal. It is a good idea to keep an eye on descending triangles and make sure that the breakouts are in the direction that you choose. |
Traders.com Advantage Staff Writer
| Title: | Webmaster |
| Company: | Technical Analysis, Inc. |
| Address: | 4757 California AVE SW |
| Seattle, WA 98116 | |
| Phone # for sales: | 206-938-0570 |
| Fax: | 206-938-1307 |
| Website: | www.traders.com |
| E-mail address: | hkim@traders.com |
Traders' Resource Links | |
| Charting the Stock Market: The Wyckoff Method -- Books | |
| Working-Money.com -- Online Trading Services | |
| Traders.com Advantage -- Online Trading Services | |
| Technical Analysis of Stocks & Commodities -- Publications and Newsletters | |
| Working Money, at Working-Money.com -- Publications and Newsletters | |
| Traders.com Advantage -- Publications and Newsletters | |
| Professional Traders Starter Kit -- Software | |
Click here for more information about our publications!
Comments

|

Request Information From Our Sponsors
- VectorVest, Inc.
- Executive Premier Workshop
- One-Day Options Course
- OptionsPro
- Retirement Income Workshop
- Sure-Fire Trading Systems (VectorVest, Inc.)
- Trading as a Business Workshop
- VectorVest 7 EOD
- VectorVest 7 RealTime/IntraDay
- VectorVest AutoTester
- VectorVest Educational Services
- VectorVest OnLine
- VectorVest Options Analyzer
- VectorVest ProGraphics v6.0
- VectorVest ProTrader 7
- VectorVest RealTime Derby Tool
- VectorVest Simulator
- VectorVest Variator
- VectorVest Watchdog
- StockCharts.com, Inc.
- Candle Patterns
- Candlestick Charting Explained
- Intermarket Technical Analysis
- John Murphy on Chart Analysis
- John Murphy's Chart Pattern Recognition
- John Murphy's Market Message
- MurphyExplainsMarketAnalysis-Intermarket Analysis
- MurphyExplainsMarketAnalysis-Visual Analysis
- StockCharts.com
- Technical Analysis of the Financial Markets
- The Visual Investor
