HOT TOPICS LIST
- MACD
- Fibonacci
- RSI
- Gann
- ADXR
- Stochastics
- Volume
- Triangles
- Futures
- Cycles
- Volatility
- ZIGZAG
- MESA
- Retracement
- Aroon
INDICATORS LIST
LIST OF TOPICS
PRINT THIS ARTICLE
by Arthur Hill
Even though a consolidation formed over the last few weeks, high volume shows that a battle is raging and the next break is crucial for the iShares Financial Services ETF (IYG).
Position: Hold
Arthur Hill
Arthur Hill is currently editor of TDTrader.com, a website specializing in trading strategies, sector/industry specific breadth stats and overall technical analysis. He passed the Society of Technical Analysts (STA London) diploma exam with distinction is a Certified Financial Technician (CFTe). Prior to TD Trader, he was the Chief Technical Analyst for Stockcharts.com and the main contributor to the ChartSchool.
PRINT THIS ARTICLE
GAPS
iShares Financial Services ETF Holding Big Gap
06/16/05 07:46:13 AMby Arthur Hill
Even though a consolidation formed over the last few weeks, high volume shows that a battle is raging and the next break is crucial for the iShares Financial Services ETF (IYG).
Position: Hold
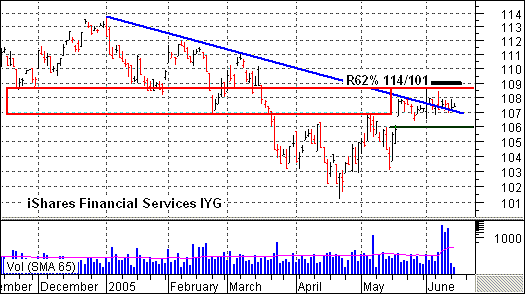
| The mid-May gap is bullish and has yet to be proven otherwise, but resistance at 108.5 is mighty stiff. Actually, there is a resistance zone that extends from 107 to 108.5. This area marked support from late November to late February and then turned into resistance over the last few weeks. The trendline extending down from January confirms this resistance area. In addition, the April-June 2005 advance marks a 62% retracement of the prior decline (Figure 1). |

|
| Figure 1: iShares Financial Services ETF. The April-June advance marks a 62% retracement of the prior decline. |
| Graphic provided by: MetaStock. |
| Graphic provided by: Reuters Data. |
| |
| The index consolidated after the mid-May gap, but volume has been unusually heavy. Volume usually contracts during a trading range or consolidation, and this massive surge in volume reflects a big battle between bulls and bears. Despite new fuel (volume) coming into the stock, neither bulls nor bears have been strong enough to forge a breakout, and the trading range rules the roost. |
| The current trading range holds the key. When in doubt, it is best to wait for a breakout. The stock failed at 108.5 on June 1, and this level marks resistance. A break above this level would signal a continuation higher and open the door to a test of the January high. Conversely, a move below 106 would break consolidation support and fill the gap. This would negate the gap and call for a test of the April lows, possibly even lower. |
Arthur Hill is currently editor of TDTrader.com, a website specializing in trading strategies, sector/industry specific breadth stats and overall technical analysis. He passed the Society of Technical Analysts (STA London) diploma exam with distinction is a Certified Financial Technician (CFTe). Prior to TD Trader, he was the Chief Technical Analyst for Stockcharts.com and the main contributor to the ChartSchool.
| Title: | Editor |
| Company: | TDTrader.com |
| Address: | Willem Geetsstraat 17 |
| Mechelen, B2800 | |
| Phone # for sales: | 3215345465 |
| Website: | www.tdtrader.com |
| E-mail address: | arthurh@tdtrader.com |
Traders' Resource Links | |
| TDTrader.com has not added any product or service information to TRADERS' RESOURCE. | |
Click here for more information about our publications!
Comments
Date: 06/16/05Rank: 4Comment:

|

Request Information From Our Sponsors
- StockCharts.com, Inc.
- Candle Patterns
- Candlestick Charting Explained
- Intermarket Technical Analysis
- John Murphy on Chart Analysis
- John Murphy's Chart Pattern Recognition
- John Murphy's Market Message
- MurphyExplainsMarketAnalysis-Intermarket Analysis
- MurphyExplainsMarketAnalysis-Visual Analysis
- StockCharts.com
- Technical Analysis of the Financial Markets
- The Visual Investor
- VectorVest, Inc.
- Executive Premier Workshop
- One-Day Options Course
- OptionsPro
- Retirement Income Workshop
- Sure-Fire Trading Systems (VectorVest, Inc.)
- Trading as a Business Workshop
- VectorVest 7 EOD
- VectorVest 7 RealTime/IntraDay
- VectorVest AutoTester
- VectorVest Educational Services
- VectorVest OnLine
- VectorVest Options Analyzer
- VectorVest ProGraphics v6.0
- VectorVest ProTrader 7
- VectorVest RealTime Derby Tool
- VectorVest Simulator
- VectorVest Variator
- VectorVest Watchdog
