HOT TOPICS LIST
- MACD
- Fibonacci
- RSI
- Gann
- ADXR
- Stochastics
- Volume
- Triangles
- Futures
- Cycles
- Volatility
- ZIGZAG
- MESA
- Retracement
- Aroon
INDICATORS LIST
LIST OF TOPICS
PRINT THIS ARTICLE
by Arthur Hill
The GS Agriculture Index ($GKX) has held key support and broken resistance to signal a continuation higher.
Position: Buy
Arthur Hill
Arthur Hill is currently editor of TDTrader.com, a website specializing in trading strategies, sector/industry specific breadth stats and overall technical analysis. He passed the Society of Technical Analysts (STA London) diploma exam with distinction is a Certified Financial Technician (CFTe). Prior to TD Trader, he was the Chief Technical Analyst for Stockcharts.com and the main contributor to the ChartSchool.
PRINT THIS ARTICLE
MOVING AVERAGES
Ag Prices Ready To Move Higher
06/16/05 12:08:03 PMby Arthur Hill
The GS Agriculture Index ($GKX) has held key support and broken resistance to signal a continuation higher.
Position: Buy
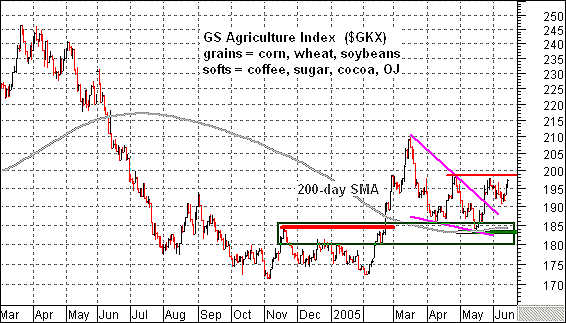
| On Figure 1, the index formed a double bottom from November 2004 to February 2005 and broke resistance at 185 with a big surge. The move exceeded the double bottom target and created an overbought situation in mid-March. In addition, note that the index broke the 200-day simple moving average (SMA) with relative ease. |
| Big moves create overbought situations and a correction was needed. The index obliged with a classic corrective decline. First, the decline formed a falling wedge. Second, the move retraced around 62% of the prior advance. Third, the index found support near broken resistance. And finally, the 200-day SMA turned into support in mid-May. All the makings for a classic correction were in place. |

|
| Figure 1: GS Agriculture Index. The index formed a double bottom from November 2004 to February 2005 and broke resistance at 185 with a surge. |
| Graphic provided by: MetaStock. |
| Graphic provided by: Reuters Data. |
| |
| Even though the correction was a classic, a bullish catalyst was needed to reverse the downtrend from mid-March to mid-May. That catalyst came in the form of a May surge. At the very least, the May surge reinforces support around 185. At the most, it calls for a continuation of the February-March advance and projects further strength toward last year's high (~250). |
| There is just one more piece of resistance in the way. The index stalled near the April high, and further strength above 200 would be unequivocally bullish. Should the index fall below 200, it would take a move below the May low (183) to call for a failure and turn bearish. |
Arthur Hill is currently editor of TDTrader.com, a website specializing in trading strategies, sector/industry specific breadth stats and overall technical analysis. He passed the Society of Technical Analysts (STA London) diploma exam with distinction is a Certified Financial Technician (CFTe). Prior to TD Trader, he was the Chief Technical Analyst for Stockcharts.com and the main contributor to the ChartSchool.
| Title: | Editor |
| Company: | TDTrader.com |
| Address: | Willem Geetsstraat 17 |
| Mechelen, B2800 | |
| Phone # for sales: | 3215345465 |
| Website: | www.tdtrader.com |
| E-mail address: | arthurh@tdtrader.com |
Traders' Resource Links | |
| TDTrader.com has not added any product or service information to TRADERS' RESOURCE. | |
Click here for more information about our publications!
Comments
Date: 06/16/05Rank: 4Comment:

|

Request Information From Our Sponsors
- StockCharts.com, Inc.
- Candle Patterns
- Candlestick Charting Explained
- Intermarket Technical Analysis
- John Murphy on Chart Analysis
- John Murphy's Chart Pattern Recognition
- John Murphy's Market Message
- MurphyExplainsMarketAnalysis-Intermarket Analysis
- MurphyExplainsMarketAnalysis-Visual Analysis
- StockCharts.com
- Technical Analysis of the Financial Markets
- The Visual Investor
- VectorVest, Inc.
- Executive Premier Workshop
- One-Day Options Course
- OptionsPro
- Retirement Income Workshop
- Sure-Fire Trading Systems (VectorVest, Inc.)
- Trading as a Business Workshop
- VectorVest 7 EOD
- VectorVest 7 RealTime/IntraDay
- VectorVest AutoTester
- VectorVest Educational Services
- VectorVest OnLine
- VectorVest Options Analyzer
- VectorVest ProGraphics v6.0
- VectorVest ProTrader 7
- VectorVest RealTime Derby Tool
- VectorVest Simulator
- VectorVest Variator
- VectorVest Watchdog
