HOT TOPICS LIST
- MACD
- Fibonacci
- RSI
- Gann
- ADXR
- Stochastics
- Volume
- Triangles
- Futures
- Cycles
- Volatility
- ZIGZAG
- MESA
- Retracement
- Aroon
INDICATORS LIST
LIST OF TOPICS
PRINT THIS ARTICLE
by Paolo Pezzutti
Prices have no directionality and low volatility, providing the expectation for a new trend to be born soon.
Position: N/A
Paolo Pezzutti
Author of the book "Trading the US Markets - A Comprehensive Guide to US Markets for International Traders and Investors" - Harriman House (July 2008)
PRINT THIS ARTICLE
Citigroup: A Trend Is About To Emerge
06/15/05 09:03:27 AMby Paolo Pezzutti
Prices have no directionality and low volatility, providing the expectation for a new trend to be born soon.
Position: N/A
| Citigroup Inc. is the nation's largest financial services holding company, whose businesses provide a range of financial services to consumer and corporate customers with more than 200 million accounts in more than 100 countries. The company provides an array of banking, lending, insurance, and investment services, a range of financial products and services, life insurance, annuities and asset management products, private equity investments, and so forth. |
| In the recent past, the press has reported that Citigroup has agreed to a settlement in the Enron class action litigation currently pending. They will make a pretax payment of $2 billion to the settlement class, which consists of all purchasers of publicly traded equity and debt securities issued by Enron and Enron-related entities between September 9, 1997, and December 2, 2001. The company reported that the settlement is covered by existing litigation reserves and that remaining reserves are considered adequate to meet the exposure to additional pending Enron cases. Citigroup denied committing any violation of law and has agreed to the settlement solely to eliminate uncertainties, burden, and expense of further protracted litigation. The Enron settlement is the latest in a series of such deals for Citigroup. The company in the past agreed also to settle class action claims stemming from the WorldCom and Global Crossing cases. It is important to remember that the collapse of Enron, which went bankrupt in 2001, caused between $40 and $45 billion in market losses. The settlement announced Friday, June 10, is the largest payout so far pledged to Enron investors. Other financial institutions named in the case allegedly helped Enron set up partnerships used to improperly boost profits and moving billions of dollars of debt off its balance sheet. That allowed Enron to report higher cash flow from operations and lower debt, making its financial picture look better than it was, according to the lawsuit. |

|
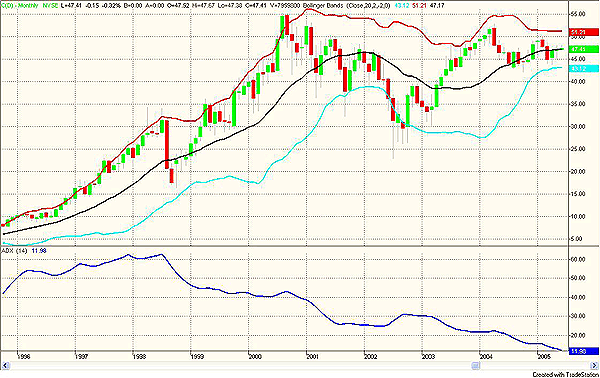
| Figure 1: The Citigroup monthly chart displays a nondirectional phase. |
| Graphic provided by: TradeStation. |
| |
| Let's look at the technical situation of the stock. In Figure 1, you can see a monthly chart of the past 10 years. In four years, prices went up from $10 in 1996 to the record high of about $55 in 2000. Not exactly the performance that many of the tech stock displayed in those years, but really, not a bad one! From that moment on, a correction started that brought prices to lose 50% and print a low in 2002 at about $25. Looking at Elliott waves, we can say that wave 3 ended in 2000 and then started a long wave 4 that is still not finished. Typically, volatility went progressively down together with directionality. The average directional movement index (ADX) attempts to measure the trending quality of a security independent of direction. The greater the ADX value, the stronger a security is trending. Traditionally, it is said that values above 30 indicate an ongoing trend. This indicator reached the exceptionally high value of 60 in 1998 and then went down continuously to the value of 12 it has nowadays. At a current price of $47, prices are not far from the relative high of $53 printed in 2004. The stock is now in a trading range, moving sideways within parallel Bollinger Bands. |

|
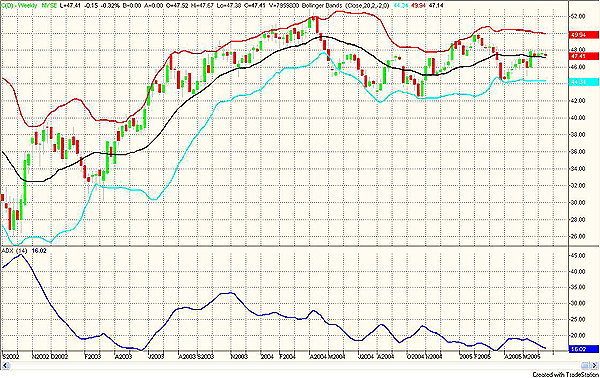
| Figure 2: The weekly chart is printing a two-year-long trading range. |
| Graphic provided by: TradeStation. |
| |
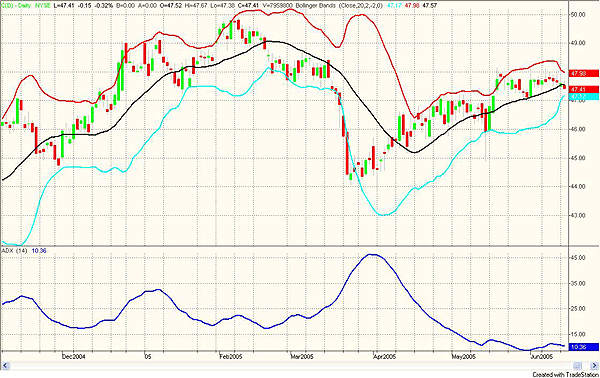
| In Figure 2, you can see a weekly chart of Citigroup. In addition, in this time frame, the stock is in a trading range, characterized by low directionality and the ADX at a value of 16. Prices are moving within the Bollinger Bands with resistance at $50 and support at $44. In Figure 3 you can see the daily chart. The situation is pretty much the same displayed in the higher time frames. The big swings of the past year or so have not been an easy trading environment. Note, for example, the high-volatility move that brought prices from $50 to $44 in February and March 2005 with the ADX value at $45. What seemed like impulse in the direction of a new downtrend instead brought prices back up to $48, negating the trend development. Prices now are in a long congestion that started on May 18 for 19 bars! The ADX is at a record level low of 10. Bollinger Bands are very narrow and still converging. |

|
| Figure 3: The Citigroup daily chart is printing a long congestion phase with extremely low ADX values. From here, volatility is about to rise in a new trend. |
| Graphic provided by: TradeStation. |
| |
| Last week, news was not able to move prices. A start of a new trend could have been triggered, but the bad news was either expected or deemed not to impact on the company. In all time frames, you can see very low volatility and directionality; on the daily chart especially, the very long congestion is associated with extremely low values of the ADX and narrow Bollinger Bands. In this market condition, you can expect a new trend emerging from the prolonged congestion. If you were to switch your trading style to a "breakout mode," it might be possible to enter the market and exploit the high-volatility environment to come. Given the absence of reaction of prices to bad news, you could assess that it is more likely a breakout move to the upside. I'd rather wait and see, which may reduce the potential profit. But it could also mean entering the market with a high-probability trade, which will bring high volatility in the direction of the new trend. |
Author of the book "Trading the US Markets - A Comprehensive Guide to US Markets for International Traders and Investors" - Harriman House (July 2008)
| Address: | VIA ROBERTO AGO 26 POSTAL CODE 00166 |
| Rome, ITALY | |
| Phone # for sales: | +393357540708 |
| E-mail address: | pezzutti.paolo@tiscali.it |
Click here for more information about our publications!
Comments
Date: 06/15/05Rank: 4Comment:
Date: 06/16/05Rank: 4Comment:
Date: 06/18/05Rank: 4Comment:
Date: 06/24/05Rank: 4Comment:

Request Information From Our Sponsors
- VectorVest, Inc.
- Executive Premier Workshop
- One-Day Options Course
- OptionsPro
- Retirement Income Workshop
- Sure-Fire Trading Systems (VectorVest, Inc.)
- Trading as a Business Workshop
- VectorVest 7 EOD
- VectorVest 7 RealTime/IntraDay
- VectorVest AutoTester
- VectorVest Educational Services
- VectorVest OnLine
- VectorVest Options Analyzer
- VectorVest ProGraphics v6.0
- VectorVest ProTrader 7
- VectorVest RealTime Derby Tool
- VectorVest Simulator
- VectorVest Variator
- VectorVest Watchdog
- StockCharts.com, Inc.
- Candle Patterns
- Candlestick Charting Explained
- Intermarket Technical Analysis
- John Murphy on Chart Analysis
- John Murphy's Chart Pattern Recognition
- John Murphy's Market Message
- MurphyExplainsMarketAnalysis-Intermarket Analysis
- MurphyExplainsMarketAnalysis-Visual Analysis
- StockCharts.com
- Technical Analysis of the Financial Markets
- The Visual Investor
