HOT TOPICS LIST
- MACD
- Fibonacci
- RSI
- Gann
- ADXR
- Stochastics
- Volume
- Triangles
- Futures
- Cycles
- Volatility
- ZIGZAG
- MESA
- Retracement
- Aroon
INDICATORS LIST
LIST OF TOPICS
PRINT THIS ARTICLE
by David Penn
Shares of Sears Holdings slip from a hot trend channel to a cooler one ... and now look to slip free from that one as well.
Position: N/A
David Penn
Technical Writer for Technical Analysis of STOCKS & COMMODITIES magazine, Working-Money.com, and Traders.com Advantage.
PRINT THIS ARTICLE
CHANNEL LINES
Sears Settles Down
06/15/05 10:50:26 AMby David Penn
Shares of Sears Holdings slip from a hot trend channel to a cooler one ... and now look to slip free from that one as well.
Position: N/A
| Next to Google, is there a stock that more sharpshooting short-sellers are dreaming about shooting from the sky than Sears Holdings (SHLD)? |
| Sears has certainly spent some time up in the air in recent months. Putting in a low in January 2005 (a low that occurred with a positive stochastic divergence, I might add), SHLD has been the anti-2005. The stock moved up from those lows near 85, broke out above its previous consolidation range in March--as the stock entered triple digits--and after consolidating over the course of April and May, broke out to new highs again in early June. |

|
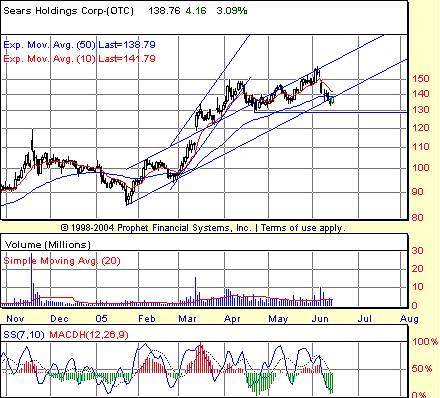
| Figure 1: A tale of two channels. A slip below the lower boundary of the original trend channel would be a bearish sign for Sears. |
| Graphic provided by: Prophet Financial, Inc. |
| |
| That, as they say, was then. In mid-June, Sears is presenting some interesting situations for investors and traders (Figure 1). The foremost situation is the repenetration of and subsequent breakdown from the older of two trend channels that have bound SHLD's rally since mid-January. If you've read any of my recent articles on trend channels (or more specifically, channel pairs), then you know that as bearish as it might have been when Sears fell from its secondary channel (March through mid-April) back into its initial channel (that began in mid-January), it was all the more bearish when SHLD fell through the lower boundary of that old channel. There is support at the level of the breakdown. At approximately the 130 level, there is a chance that the April lows will provide some support, perhaps for a retest of the break through the old channel's lower boundary. This is what SHLD appears to be trying to do here in mid-June. |
| Already below both its 10- and 50-day exponential moving averages (EMAs), Sears is likely to move between the lower boundary of the old channel--a boundary that should now act as resistance--and the horizontal support line at 130. In fact, it would not surprise me in the least if Sears actually rode up the backside of that lower boundary for a period of time in an attempt to set a new high north of about 159. Such a move might be star-crossed, however. The early June high in SHLD also arrives with a negative stochastic divergence. Actually, it could be argued that the June high in Sears has been accompanied by a running, or multiple, stochastic divergence. Note the consecutively higher price highs in early May, late May, and then early June. At the same time that prices are making higher highs, the 7,10 stochastic is making a series of lower highs. |
| Sears is oversold at present, according to the crashing stochastic. As the stock bounces, it will be worthwhile noting how quickly that oversold condition is worked off. In the meanwhile, the running negative stochastic divergence and the breakdown from the old trend channel both warn traders and investors that the upside in Sears, for the time being, may be quite limited. |
Technical Writer for Technical Analysis of STOCKS & COMMODITIES magazine, Working-Money.com, and Traders.com Advantage.
| Title: | Technical Writer |
| Company: | Technical Analysis, Inc. |
| Address: | 4757 California Avenue SW |
| Seattle, WA 98116 | |
| Phone # for sales: | 206 938 0570 |
| Fax: | 206 938 1307 |
| Website: | www.Traders.com |
| E-mail address: | DPenn@traders.com |
Traders' Resource Links | |
| Charting the Stock Market: The Wyckoff Method -- Books | |
| Working-Money.com -- Online Trading Services | |
| Traders.com Advantage -- Online Trading Services | |
| Technical Analysis of Stocks & Commodities -- Publications and Newsletters | |
| Working Money, at Working-Money.com -- Publications and Newsletters | |
| Traders.com Advantage -- Publications and Newsletters | |
| Professional Traders Starter Kit -- Software | |
Click here for more information about our publications!
Comments
Date: 06/15/05Rank: 3Comment:
Date: 06/16/05Rank: 3Comment:

|

Request Information From Our Sponsors
- StockCharts.com, Inc.
- Candle Patterns
- Candlestick Charting Explained
- Intermarket Technical Analysis
- John Murphy on Chart Analysis
- John Murphy's Chart Pattern Recognition
- John Murphy's Market Message
- MurphyExplainsMarketAnalysis-Intermarket Analysis
- MurphyExplainsMarketAnalysis-Visual Analysis
- StockCharts.com
- Technical Analysis of the Financial Markets
- The Visual Investor
- VectorVest, Inc.
- Executive Premier Workshop
- One-Day Options Course
- OptionsPro
- Retirement Income Workshop
- Sure-Fire Trading Systems (VectorVest, Inc.)
- Trading as a Business Workshop
- VectorVest 7 EOD
- VectorVest 7 RealTime/IntraDay
- VectorVest AutoTester
- VectorVest Educational Services
- VectorVest OnLine
- VectorVest Options Analyzer
- VectorVest ProGraphics v6.0
- VectorVest ProTrader 7
- VectorVest RealTime Derby Tool
- VectorVest Simulator
- VectorVest Variator
- VectorVest Watchdog
