HOT TOPICS LIST
- MACD
- Fibonacci
- RSI
- Gann
- ADXR
- Stochastics
- Volume
- Triangles
- Futures
- Cycles
- Volatility
- ZIGZAG
- MESA
- Retracement
- Aroon
INDICATORS LIST
LIST OF TOPICS
PRINT THIS ARTICLE
by David Penn
As the telecom index surges into a secondary trend channel, negative stochastic divergences emerge.
Position: N/A
David Penn
Technical Writer for Technical Analysis of STOCKS & COMMODITIES magazine, Working-Money.com, and Traders.com Advantage.
PRINT THIS ARTICLE
CHANNEL LINES
A Top In Telecom?
06/15/05 07:49:49 AMby David Penn
As the telecom index surges into a secondary trend channel, negative stochastic divergences emerge.
Position: N/A
| At first glance, a headline like "A Top In Telecom?" sounds like something out of vintage 1999 financial news lore. After all, a "top" only arrives after some period of "going up," and telecom stocks banned the practice of "going up" years ago, didn't they? |
| In truth, telecom stocks have been one of the market's strongest performers during the bull market from the autumn of 2002 up until recent months. The AMEX North American telecom index more than doubled from its September 2002 low just north of 300 to its December 2004 high just north of 700. |

|
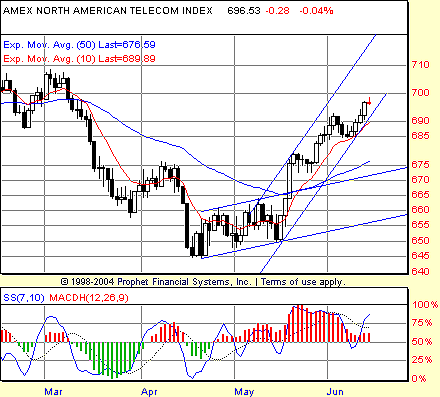
| Figure 1: An extended $XTC can either vault higher into near-vertical mode or plow into the side of the lower boundary of its secondary trend channel. |
| Graphic provided by: Prophet Financial, Inc. |
| |
| But like most stocks in 2005, telecom stocks (as represented by the telecom index $XTC) have suffered, falling from their late December 2004 closing high of about 720 to a mid-April 2005 low of about 645, a decline of about 10% (Figure 1). On the other hand, since that decline ended, telecom stocks have been on a tear, spending about 60 days recouping the lion's share of the decline. For the record, I had suggested the possibility of upside in telecommunications stocks back in April ("Telecom's Time To Shine?," Traders.com Advantage, April 7, 2005). |
| There are a number of interesting developments in telecom--again as represented by $XTC--since that rally began. The first are the trend channel pairs that mark first $XTC's initial "taxiing" or acceleration from mid-April to mid-May, then the index's "takeoff" from mid-May to mid-June. What is so helpful about channel pairs is that they show just what it would take for a given stock, index, or commodity to continue to advance (or decline) at a given rate. Clearly, looking at the second channel in $XTC, the only way this index could do any better would be for it to begin moving literally straight up. |
| And maybe it will. Elsewhere in the chart, we can see how a running negative stochastic divergence has developed over the past month between the soaring $XTC and the increasingly earthbound 7,10 stochastic. The first negative divergence developed between the May highs and the high in early June. And currently, a second negative divergence seems to be developing with the rally into the middle of the month. There is no doubt that $XTC is extended at this point. In addition to the secondary trend channel and the running negative stochastic divergence, the index is trading 10 points above its 10-day exponential moving average (EMA) and almost 25 points above its 50-day EMA. Even if a trader or investor remains bullish on telecom at this point, there is every reason to believe that a pullback (at a minimum) or a correction (more likely) is ahead for $XTC. |
Technical Writer for Technical Analysis of STOCKS & COMMODITIES magazine, Working-Money.com, and Traders.com Advantage.
| Title: | Technical Writer |
| Company: | Technical Analysis, Inc. |
| Address: | 4757 California Avenue SW |
| Seattle, WA 98116 | |
| Phone # for sales: | 206 938 0570 |
| Fax: | 206 938 1307 |
| Website: | www.Traders.com |
| E-mail address: | DPenn@traders.com |
Traders' Resource Links | |
| Charting the Stock Market: The Wyckoff Method -- Books | |
| Working-Money.com -- Online Trading Services | |
| Traders.com Advantage -- Online Trading Services | |
| Technical Analysis of Stocks & Commodities -- Publications and Newsletters | |
| Working Money, at Working-Money.com -- Publications and Newsletters | |
| Traders.com Advantage -- Publications and Newsletters | |
| Professional Traders Starter Kit -- Software | |
Click here for more information about our publications!
Comments
Date: 06/15/05Rank: 3Comment:
Date: 06/16/05Rank: 4Comment:

|

Request Information From Our Sponsors
- VectorVest, Inc.
- Executive Premier Workshop
- One-Day Options Course
- OptionsPro
- Retirement Income Workshop
- Sure-Fire Trading Systems (VectorVest, Inc.)
- Trading as a Business Workshop
- VectorVest 7 EOD
- VectorVest 7 RealTime/IntraDay
- VectorVest AutoTester
- VectorVest Educational Services
- VectorVest OnLine
- VectorVest Options Analyzer
- VectorVest ProGraphics v6.0
- VectorVest ProTrader 7
- VectorVest RealTime Derby Tool
- VectorVest Simulator
- VectorVest Variator
- VectorVest Watchdog
- StockCharts.com, Inc.
- Candle Patterns
- Candlestick Charting Explained
- Intermarket Technical Analysis
- John Murphy on Chart Analysis
- John Murphy's Chart Pattern Recognition
- John Murphy's Market Message
- MurphyExplainsMarketAnalysis-Intermarket Analysis
- MurphyExplainsMarketAnalysis-Visual Analysis
- StockCharts.com
- Technical Analysis of the Financial Markets
- The Visual Investor
