HOT TOPICS LIST
- MACD
- Fibonacci
- RSI
- Gann
- ADXR
- Stochastics
- Volume
- Triangles
- Futures
- Cycles
- Volatility
- ZIGZAG
- MESA
- Retracement
- Aroon
INDICATORS LIST
LIST OF TOPICS
PRINT THIS ARTICLE
by David Penn
The rally in shares of Forest Labs has everything a bull might want ... except for more bulls.
Position: N/A
David Penn
Technical Writer for Technical Analysis of STOCKS & COMMODITIES magazine, Working-Money.com, and Traders.com Advantage.
PRINT THIS ARTICLE
VOLUME
Waiting For Volume
06/14/05 07:47:16 AMby David Penn
The rally in shares of Forest Labs has everything a bull might want ... except for more bulls.
Position: N/A
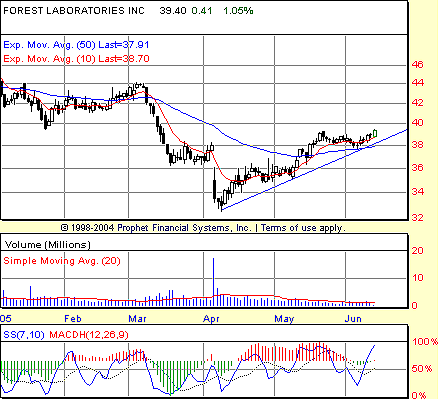
| Forest Labs (FRX) was hammered in spring 2005. From a March high near 44, shares of FRX fell fully 25% in about a month when the stock bottomed in early April at about 33. The volume on that bottom was massive; as Figure 1 shows, the volume spike clearly stands out among all recent daily trading volumes. While it is easier to say so now than it must have been then, clearly early April occasioned a massive selling climax in FRX. |
| Since that selling climax, FRX has advanced steadily. For going on two months, the stock climbed back above its 10-day exponential moving average (EMA) early in May and above its 50-day EMA later in the month, just as that same 10-day EMA was crossing back above the 50-day. |

|
| Figure 1: Multiple sources of support appear at the 10- and 50-day EMAs, as well as at a trendline that extends back to the April lows. |
| Graphic provided by: Prophet Financial, Inc. |
| |
| All in all, it's been a set of particularly bullish developments for Forest Labs: a selling climax and a subsequent rally that rose above potential resistance at two major moving averages. The corrections in this rally occurred from mid-April to mid-May, and then again from mid-May to mid-June, and developed as more sideways than downward, which suggests a fairly consistent buying interest in the market. |
| For all that buying interest, though, Forest Labs has yet to see significant increases in volume. It is as if there were enough buying interest to keep FRX aloft, but not quite enough to provide the kind of breakout that might send the stock soaring. FRX is in an interesting position in mid-June. Drifting upward on light volume in recent days, Forest Labs has found itself just above potential support at the 10- and 50-day EMAs, as well as a trendline that extends back to the selling climax in early April. |
| Right now, FRX looks poised to plow right into the side of that trendline. Should it do so, then the prospects for FRX moving higher in the near term would be diminished somewhat, as it would mean a break of the more than two-month-old uptrend. On the other hand, if FRX finds the same sort of support at this trendline that it experienced back in early May, then FRX bulls could be rewarded with another leg higher. And maybe this time, the bulls will bring along some friends. |
Technical Writer for Technical Analysis of STOCKS & COMMODITIES magazine, Working-Money.com, and Traders.com Advantage.
| Title: | Technical Writer |
| Company: | Technical Analysis, Inc. |
| Address: | 4757 California Avenue SW |
| Seattle, WA 98116 | |
| Phone # for sales: | 206 938 0570 |
| Fax: | 206 938 1307 |
| Website: | www.Traders.com |
| E-mail address: | DPenn@traders.com |
Traders' Resource Links | |
| Charting the Stock Market: The Wyckoff Method -- Books | |
| Working-Money.com -- Online Trading Services | |
| Traders.com Advantage -- Online Trading Services | |
| Technical Analysis of Stocks & Commodities -- Publications and Newsletters | |
| Working Money, at Working-Money.com -- Publications and Newsletters | |
| Traders.com Advantage -- Publications and Newsletters | |
| Professional Traders Starter Kit -- Software | |
Click here for more information about our publications!
Comments
Date: 06/15/05Rank: 3Comment:

Request Information From Our Sponsors
- StockCharts.com, Inc.
- Candle Patterns
- Candlestick Charting Explained
- Intermarket Technical Analysis
- John Murphy on Chart Analysis
- John Murphy's Chart Pattern Recognition
- John Murphy's Market Message
- MurphyExplainsMarketAnalysis-Intermarket Analysis
- MurphyExplainsMarketAnalysis-Visual Analysis
- StockCharts.com
- Technical Analysis of the Financial Markets
- The Visual Investor
- VectorVest, Inc.
- Executive Premier Workshop
- One-Day Options Course
- OptionsPro
- Retirement Income Workshop
- Sure-Fire Trading Systems (VectorVest, Inc.)
- Trading as a Business Workshop
- VectorVest 7 EOD
- VectorVest 7 RealTime/IntraDay
- VectorVest AutoTester
- VectorVest Educational Services
- VectorVest OnLine
- VectorVest Options Analyzer
- VectorVest ProGraphics v6.0
- VectorVest ProTrader 7
- VectorVest RealTime Derby Tool
- VectorVest Simulator
- VectorVest Variator
- VectorVest Watchdog
