

HOT TOPICS LIST
- MACD
- Fibonacci
- RSI
- Gann
- ADXR
- Stochastics
- Volume
- Triangles
- Futures
- Cycles
- Volatility
- ZIGZAG
- MESA
- Retracement
- Aroon
INDICATORS LIST
LIST OF TOPICS
PRINT THIS ARTICLE
by Han Kim
Analyzing a bar chart for the first time can be like looking into the night sky full of stars but not being able to see any constellations. It's all in front of you, but what are you supposed to get out of it? Here's a lesson on how to read a bar chart.
Position: N/A
Han Kim
Traders.com Advantage Staff Writer
PRINT THIS ARTICLE
CHART ANALYSIS
How To Read A Bar Chart
07/18/00 10:27:31 AMby Han Kim
Analyzing a bar chart for the first time can be like looking into the night sky full of stars but not being able to see any constellations. It's all in front of you, but what are you supposed to get out of it? Here's a lesson on how to read a bar chart.
Position: N/A
| Before applying analytical tools to a bar chart, you should set up your bar chart with an appropriate time frame and price range. |
| The time frame of the bar chart is simply the window of time that you are studying. Whether it be a single day, a week, a month, or greater, the time frame is a very important part of your analysis. You want your time frame to correspond to your analysis. You should not use an intraday chart analysis to predict how the market will do the following months, and you should not use a monthly chart to do intraday analysis. |
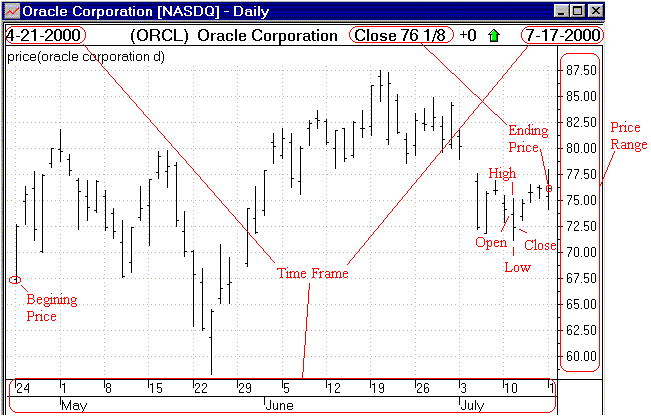
|
| Daily bar chart of Oracle (ORCL) with key elements highlighted. |
| Graphic provided by: Window. |
| |
| The highest and lowest price on the chart you are studying constitutes the magnitude of the price range. Check to see if your price range is logarithmic or linear. The difference in the high and the low of the price tells you the range of the price change and sometimes give you clues to how rapidly the prices have changed for that time frame. |
| Once the time frame and the magnitude of the price range have been determined, you are ready to start looking at the contents of the chart. You should gather the following information from the bar chart: |
| These should be readily visible and easily recognized. Comparing the current price with the price at the beginning of the time frame tells you if the security has gone up or down within the time frame. The fluctuations in the lengths of the bars, or lack thereof, reveal price action. General trend and/or patterns, if visible, will help you recognize what the security might do next. Further study of the bar charts leads to the individual bars. Depending on the time frame, each bar will contain the open, high, low, and close of the price for the specified period. What you should recognize are where it opened, where it closed, and the range in fluctuations. The open and close tells you the start and finish of the price while the high and the low gives you clues to what happened in between. |
Traders.com Advantage Staff Writer
| Title: | Webmaster |
| Company: | Technical Analysis, Inc. |
| Address: | 4757 California AVE SW |
| Seattle, WA 98116 | |
| Phone # for sales: | 206-938-0570 |
| Fax: | 206-938-1307 |
| Website: | www.traders.com |
| E-mail address: | hkim@traders.com |
Traders' Resource Links | |
| Charting the Stock Market: The Wyckoff Method -- Books | |
| Working-Money.com -- Online Trading Services | |
| Traders.com Advantage -- Online Trading Services | |
| Technical Analysis of Stocks & Commodities -- Publications and Newsletters | |
| Working Money, at Working-Money.com -- Publications and Newsletters | |
| Traders.com Advantage -- Publications and Newsletters | |
| Professional Traders Starter Kit -- Software | |
Click here for more information about our publications!
Comments
Date:�/ /Rank:�3Comment:�
Date:�/ /Rank:�4Comment:�

Request Information From Our Sponsors
- StockCharts.com, Inc.
- Candle Patterns
- Candlestick Charting Explained
- Intermarket Technical Analysis
- John Murphy on Chart Analysis
- John Murphy's Chart Pattern Recognition
- John Murphy's Market Message
- MurphyExplainsMarketAnalysis-Intermarket Analysis
- MurphyExplainsMarketAnalysis-Visual Analysis
- StockCharts.com
- Technical Analysis of the Financial Markets
- The Visual Investor
- VectorVest, Inc.
- Executive Premier Workshop
- One-Day Options Course
- OptionsPro
- Retirement Income Workshop
- Sure-Fire Trading Systems (VectorVest, Inc.)
- Trading as a Business Workshop
- VectorVest 7 EOD
- VectorVest 7 RealTime/IntraDay
- VectorVest AutoTester
- VectorVest Educational Services
- VectorVest OnLine
- VectorVest Options Analyzer
- VectorVest ProGraphics v6.0
- VectorVest ProTrader 7
- VectorVest RealTime Derby Tool
- VectorVest Simulator
- VectorVest Variator
- VectorVest Watchdog