HOT TOPICS LIST
- MACD
- Fibonacci
- RSI
- Gann
- ADXR
- Stochastics
- Volume
- Triangles
- Futures
- Cycles
- Volatility
- ZIGZAG
- MESA
- Retracement
- Aroon
INDICATORS LIST
LIST OF TOPICS
PRINT THIS ARTICLE
by Luis Ferro
Following a downtrend that lasted for six months, Delta Airlines found support at 2.5, a level that had already acted as support for this stock. Subsequently, prices rose very fast until they reached 4.35, after which a well-defined congestion pattern was formed. An upward breakout could be a highly profitable opportunity, but due to the extreme volatility of the stock, it should be played very carefully.
Position: Buy
Luis Ferro
Trader and technical analyst living in Bern, Switzerland. A full member of the STA, currently enrolled in the DITA program and the CMT program.
PRINT THIS ARTICLE
RECTANGLES
Trading Range For Delta Airlines
06/13/05 11:36:02 AMby Luis Ferro
Following a downtrend that lasted for six months, Delta Airlines found support at 2.5, a level that had already acted as support for this stock. Subsequently, prices rose very fast until they reached 4.35, after which a well-defined congestion pattern was formed. An upward breakout could be a highly profitable opportunity, but due to the extreme volatility of the stock, it should be played very carefully.
Position: Buy
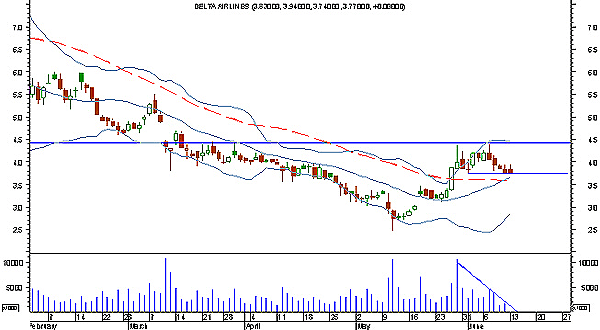
| The daily candlestick chart of Delta (Figure 1) shows that the downtrend ended with the formation of a bullish hammer. The airline then started to rise and prices gapped up, forming a pattern known as a "pan-fried bottom." This little-known bullish pattern is of Japanese origin and was first described in western literature by Steve Nison. It occurs when after a downtrend price first forms a rounded bottom and then gaps upward and away from the rounded bottom. It is generally considered a highly reliable pattern. The stock continued to climb after the gap and prices crossed above the 50-day simple moving average and the upper line of the Bollinger Bands almost simultaneously. This was the first buy signal from any of these important indicators in six months. Prices eventually reached the final (at least temporarily) high of 4.35, a rise of 77.5% from the 2.5 level in less than three weeks. The horizontal congestion pattern that formed is very well defined, with the upper limit at 4.35 and the lower limit at 3.75 and with low volume during the trading range. |

|
| Figure 1: DAL. Daily candlestick chart with Bollinger Bands and 50-day moving average. |
| Graphic provided by: MetaStock. |
| |
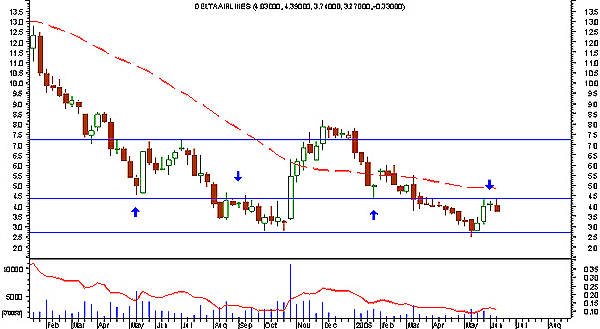
| In the weekly chart of DAL (Figure 2), it is very clear that the 2.5 level is a former support level and that the price penetration of this level was limited to an intraday penetration and that prices quickly rebounded. The 4.35, 4.5 is probably the most important level for Delta Airlines. It has acted as both support and resistance on several occasions, and breaking above it will not be easy. A positive signal comes from the 40-week simple moving average (which is almost the same as the 200-day MA). It has been penetrated recently and, perhaps more important, it is beginning to flatten, which is a signal that the longer-term trend might be changing. |

|
| Figure 2. DAL. Weekly candlestick chart with 40-week moving average. The arrows point support and resistance levels. |
| Graphic provided by: MetaStock. |
| |
| It is difficult to predict if prices will actually break above the 4.35, 4.5 resistance level. If they do, the gain can be quite substantial. The next resistance levels are at 6 and 7.25, which would represent a profit of 33% and 61%, respectively, if the stock would be bought at 4.5. But the losses can be proportional to the gains, so strict risk control and respect of stops is absolutely necessary. One useful and effectively strategy to control risk could be the purchase of call options, thereby limiting the maximum loss to the cost of the stock options. |
Trader and technical analyst living in Bern, Switzerland. A full member of the STA, currently enrolled in the DITA program and the CMT program.
| Address: | Switzerland |
| E-mail address: | luispgsf@yahoo.com |
Click here for more information about our publications!
Comments
Date: 06/13/05Rank: 3Comment:

Request Information From Our Sponsors
- VectorVest, Inc.
- Executive Premier Workshop
- One-Day Options Course
- OptionsPro
- Retirement Income Workshop
- Sure-Fire Trading Systems (VectorVest, Inc.)
- Trading as a Business Workshop
- VectorVest 7 EOD
- VectorVest 7 RealTime/IntraDay
- VectorVest AutoTester
- VectorVest Educational Services
- VectorVest OnLine
- VectorVest Options Analyzer
- VectorVest ProGraphics v6.0
- VectorVest ProTrader 7
- VectorVest RealTime Derby Tool
- VectorVest Simulator
- VectorVest Variator
- VectorVest Watchdog
- StockCharts.com, Inc.
- Candle Patterns
- Candlestick Charting Explained
- Intermarket Technical Analysis
- John Murphy on Chart Analysis
- John Murphy's Chart Pattern Recognition
- John Murphy's Market Message
- MurphyExplainsMarketAnalysis-Intermarket Analysis
- MurphyExplainsMarketAnalysis-Visual Analysis
- StockCharts.com
- Technical Analysis of the Financial Markets
- The Visual Investor
