HOT TOPICS LIST
- MACD
- Fibonacci
- RSI
- Gann
- ADXR
- Stochastics
- Volume
- Triangles
- Futures
- Cycles
- Volatility
- ZIGZAG
- MESA
- Retracement
- Aroon
INDICATORS LIST
LIST OF TOPICS
PRINT THIS ARTICLE
by David Penn
Is it the beginning of the end for the biotech rally revolution?
Position: N/A
David Penn
Technical Writer for Technical Analysis of STOCKS & COMMODITIES magazine, Working-Money.com, and Traders.com Advantage.
PRINT THIS ARTICLE
REVERSAL
Amgen's 2B Top
06/13/05 07:38:01 AMby David Penn
Is it the beginning of the end for the biotech rally revolution?
Position: N/A
Writing about the 2B top in his book, Methods Of A Wall Street Master, trader and educator Victor Sperandeo notes that:
|
| This is as good and succinct a definition of the 2B reversal as you're going to find. Although the same idea has been discovered by other traders (Larry Connors' similar techniques are called "Turtle Soup" and "Turtle Soup Plus One"), it was in Sperandeo's work that I first came across the reversal setup. |

|
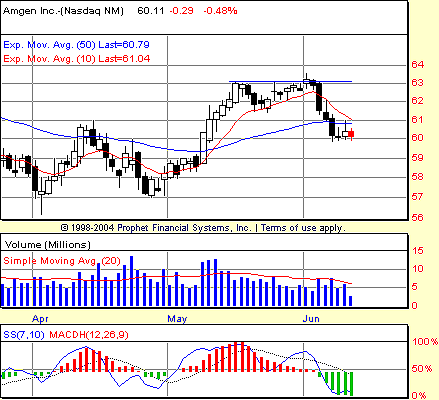
| Figure 1: After failing to follow through on the higher high in June, shares of AMGN reversed to the downside on a significant increase in volume. |
| Graphic provided by: Prophet Financial, Inc. |
| |
| The reversal in Amgen, one of the leading stars of the biotechnology group, is so far proving to be a worthwhile example of the 2B top in action. For context, it is worth noting that the topping process in May and June was a secondary one, with AMGN having fallen from a higher peak in late December (Figure 1). Nevertheless, as Sperandeo notes, 2Bs can exist in a number of different time frames, from minor highs and lows that complete 2Bs in a day or two, to intermediate highs or lows that last from three to five days, to longer-term 2Bs that can represent major turning points in a market and may require as much as a week or more for the pattern to be completed. In the case of AMGN, it appears as if 11 days transpired between the high in mid-May and the higher high in early June--which suggests that the current reversal could be a significant one indeed. With AMGN already down more than three points from its June high and slipping beneath its 50-day exponential moving average (EMA) in recent days, the notion of continued declines in this stock is not a remote one. |
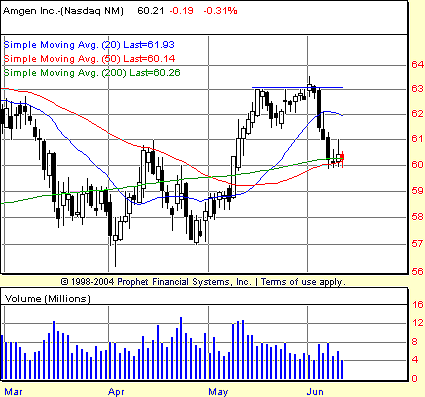
| At this point, the clearest source of support for AMGN is at 57, the lows of April (I'm excluding the intraday low early in April that neared 56.25). Right now, AMGN appears to be relying on the not-insignificant support typically provided by the 200-day simple moving average (as shown in Figure 2). Should that support fail, then a test of the April lows seems all but assured. |

|
| Figure 2: The 200-day simple moving average provides support during AMGN's June decline. |
| Graphic provided by: Prophet Financial, Inc. |
| |
Technical Writer for Technical Analysis of STOCKS & COMMODITIES magazine, Working-Money.com, and Traders.com Advantage.
| Title: | Technical Writer |
| Company: | Technical Analysis, Inc. |
| Address: | 4757 California Avenue SW |
| Seattle, WA 98116 | |
| Phone # for sales: | 206 938 0570 |
| Fax: | 206 938 1307 |
| Website: | www.Traders.com |
| E-mail address: | DPenn@traders.com |
Traders' Resource Links | |
| Charting the Stock Market: The Wyckoff Method -- Books | |
| Working-Money.com -- Online Trading Services | |
| Traders.com Advantage -- Online Trading Services | |
| Technical Analysis of Stocks & Commodities -- Publications and Newsletters | |
| Working Money, at Working-Money.com -- Publications and Newsletters | |
| Traders.com Advantage -- Publications and Newsletters | |
| Professional Traders Starter Kit -- Software | |
Click here for more information about our publications!
Comments
Date: 06/13/05Rank: 3Comment:

Request Information From Our Sponsors
- StockCharts.com, Inc.
- Candle Patterns
- Candlestick Charting Explained
- Intermarket Technical Analysis
- John Murphy on Chart Analysis
- John Murphy's Chart Pattern Recognition
- John Murphy's Market Message
- MurphyExplainsMarketAnalysis-Intermarket Analysis
- MurphyExplainsMarketAnalysis-Visual Analysis
- StockCharts.com
- Technical Analysis of the Financial Markets
- The Visual Investor
- VectorVest, Inc.
- Executive Premier Workshop
- One-Day Options Course
- OptionsPro
- Retirement Income Workshop
- Sure-Fire Trading Systems (VectorVest, Inc.)
- Trading as a Business Workshop
- VectorVest 7 EOD
- VectorVest 7 RealTime/IntraDay
- VectorVest AutoTester
- VectorVest Educational Services
- VectorVest OnLine
- VectorVest Options Analyzer
- VectorVest ProGraphics v6.0
- VectorVest ProTrader 7
- VectorVest RealTime Derby Tool
- VectorVest Simulator
- VectorVest Variator
- VectorVest Watchdog
