HOT TOPICS LIST
- MACD
- Fibonacci
- RSI
- Gann
- ADXR
- Stochastics
- Volume
- Triangles
- Futures
- Cycles
- Volatility
- ZIGZAG
- MESA
- Retracement
- Aroon
INDICATORS LIST
LIST OF TOPICS
PRINT THIS ARTICLE
by Arthur Hill
The NASDAQ advance/decline volume line has sharply outperformed the A/D line over the last few weeks, showing leadership from the generals.
Position: Hold
Arthur Hill
Arthur Hill is currently editor of TDTrader.com, a website specializing in trading strategies, sector/industry specific breadth stats and overall technical analysis. He passed the Society of Technical Analysts (STA London) diploma exam with distinction is a Certified Financial Technician (CFTe). Prior to TD Trader, he was the Chief Technical Analyst for Stockcharts.com and the main contributor to the ChartSchool.
PRINT THIS ARTICLE
A/D LINE
Generals Lead The NASDAQ Charge
06/10/05 12:06:36 PMby Arthur Hill
The NASDAQ advance/decline volume line has sharply outperformed the A/D line over the last few weeks, showing leadership from the generals.
Position: Hold
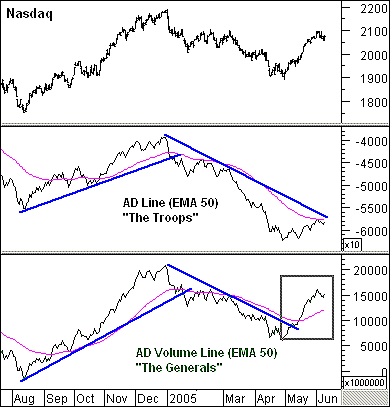
| The A/D line is a cumulative measure of advances less declines. Regardless of market-cap or volume, each issue (stock) counts once, and this is a good representation of the broader market. The A/D volume line is a cumulative measure of advancing volume less declining volume. The stocks with the highest volume dominate this index, and these also tend to be the stocks with the largest market capitalization. I like to think of the A/D volume line as the "generals" of the NASDAQ and the A/D line as the "troops" (Figure 1). It is hard to fight a war (sustain a trend) without both participating. |
| The NASDAQ advanced more than 200 points in May, and this advance was clearly led by the generals. The A/D volume line surged above the January trendline and is currently challenging its February high. In contrast, the A/D line has yet to break its 50-day exponential moving average (EMA) or the January trendline. In addition, the A/D line remains well below its February high, and the troops are not that enthusiastic about this rally. |

|
| Figure 1: The Generals vs. the Troops |
| Graphic provided by: MetaStock. |
| Graphic provided by: Reuters Data. |
| |
| It is okay for one to lag the other, but not for an extended period of time and not by a large margin. For the current rally in the NASDAQ to extend and have legs, the troops need to join the battle, and the A/D line needs to break above the January trendline. As long as the A/D line severely lags, the staying power of this rally will be in question. |
Arthur Hill is currently editor of TDTrader.com, a website specializing in trading strategies, sector/industry specific breadth stats and overall technical analysis. He passed the Society of Technical Analysts (STA London) diploma exam with distinction is a Certified Financial Technician (CFTe). Prior to TD Trader, he was the Chief Technical Analyst for Stockcharts.com and the main contributor to the ChartSchool.
| Title: | Editor |
| Company: | TDTrader.com |
| Address: | Willem Geetsstraat 17 |
| Mechelen, B2800 | |
| Phone # for sales: | 3215345465 |
| Website: | www.tdtrader.com |
| E-mail address: | arthurh@tdtrader.com |
Traders' Resource Links | |
| TDTrader.com has not added any product or service information to TRADERS' RESOURCE. | |
Click here for more information about our publications!
Comments
Date: 06/11/05Rank: 4Comment:
Date: 06/23/05Rank: 5Comment:

|

Request Information From Our Sponsors
- StockCharts.com, Inc.
- Candle Patterns
- Candlestick Charting Explained
- Intermarket Technical Analysis
- John Murphy on Chart Analysis
- John Murphy's Chart Pattern Recognition
- John Murphy's Market Message
- MurphyExplainsMarketAnalysis-Intermarket Analysis
- MurphyExplainsMarketAnalysis-Visual Analysis
- StockCharts.com
- Technical Analysis of the Financial Markets
- The Visual Investor
- VectorVest, Inc.
- Executive Premier Workshop
- One-Day Options Course
- OptionsPro
- Retirement Income Workshop
- Sure-Fire Trading Systems (VectorVest, Inc.)
- Trading as a Business Workshop
- VectorVest 7 EOD
- VectorVest 7 RealTime/IntraDay
- VectorVest AutoTester
- VectorVest Educational Services
- VectorVest OnLine
- VectorVest Options Analyzer
- VectorVest ProGraphics v6.0
- VectorVest ProTrader 7
- VectorVest RealTime Derby Tool
- VectorVest Simulator
- VectorVest Variator
- VectorVest Watchdog
