HOT TOPICS LIST
- MACD
- Fibonacci
- RSI
- Gann
- ADXR
- Stochastics
- Volume
- Triangles
- Futures
- Cycles
- Volatility
- ZIGZAG
- MESA
- Retracement
- Aroon
INDICATORS LIST
LIST OF TOPICS
PRINT THIS ARTICLE
by David Penn
As tech gets toppy, will the rotation turn toward basic materials stocks for the upside?
Position: N/A
David Penn
Technical Writer for Technical Analysis of STOCKS & COMMODITIES magazine, Working-Money.com, and Traders.com Advantage.
PRINT THIS ARTICLE
Back To Basics?
06/10/05 10:45:26 AMby David Penn
As tech gets toppy, will the rotation turn toward basic materials stocks for the upside?
Position: N/A
| Writing for Working-Money.com, I talked about the concept of weakness in strength ("Weakness In Strength," Working-Money.com, June 1, 2005). Essentially, this idea points out that stocks that are doing poorly during broad market upswings are likely to perform even worse during a broad market downswing. This is especially true during bear market periods, when the general trend tends to be down as often (or more so) as it is up. |
| In "Weakness In Strength," I used the example of the basic industry/basic materials type of "smokestack stocks" and their recent underperformance relative to the rest of the market in general and hot sectors like semiconductors in specific. The argument was that if the bear market that began in 2005 (January for some stocks, March for others) resumed its descent, smokestack stocks that participated the least in the April to June rally will be the stocks most deleteriously effected. |

|
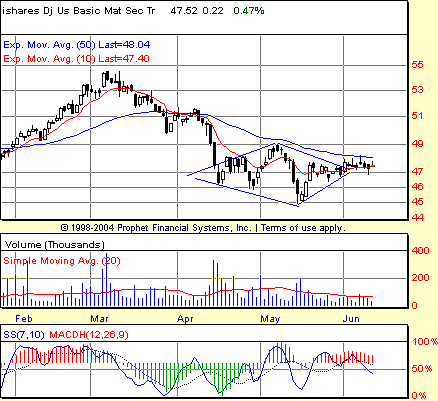
| Figure 1: IYM. The positive stochastic divergence within this diamond consolidation suggests the potential for upside in IYM. |
| Graphic provided by: Prophet Financial, Inc. |
| |
But as I noted at the end of that article, such a doomsday scenario for the smokestack stocks does not necessarily preclude a bounce, a trade into those stocks as the currently high-flying technology stocks begin to correct. Particularly, I wrote that:
That sentiment is at the core of this far-shorter dispatch. Key indexes of smokestack stock activity--the IYM, the $CYC, and the XLB--have been developing interesting price patterns and indicator readings that suggest that just such a "rotation ... back into smokestack stocks" might be under way. |

|
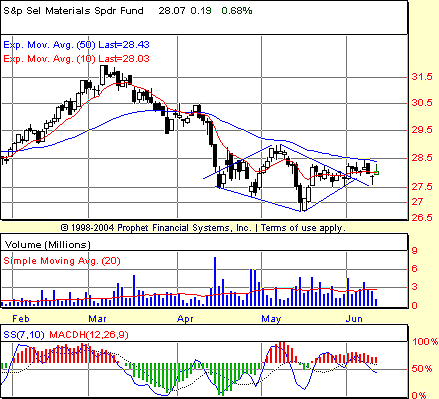
| Figure 2: XLB. Note the increase in volume on the breakout from the diamond pattern in early June. Positive divergences here also suggest the potential for higher prices for basic materials stocks. |
| Graphic provided by: Prophet Financial, Inc. |
| |
| It is important to note that basic materials stocks, seen through the lens of these exchange-traded funds, still have overhead resistance in the form of the 50-day exponential moving average (EMA). Even the top of the diamond pattern itself could prove an impenetrable barrier to price advances in the near term (Figure 2). One of the more interesting examples of diamond patterns in the second edition of Thomas Bulkowski's Encyclopedia Of Chart Patterns underscores the role that resistance can play in limiting--or nullifying entirely--an aspiring upside breakout. |

|
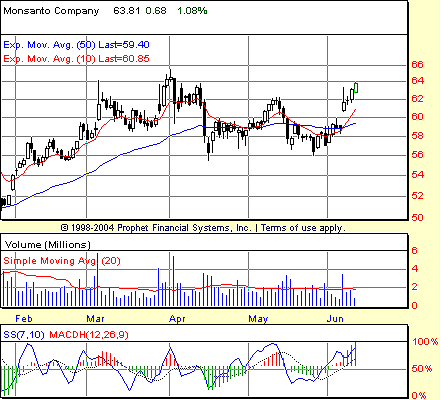
| Figure 3: MON. Monsanto is among the few industrial companies that have performed well over the course of spring 2005. Note the high volume on the early June breakout. |
| Graphic provided by: Prophet Financial, Inc. |
| |
| Nevertheless, as I suggested in Working-Money a few weeks ago in the forementioned article, opportunity might just be found among these smokestack stocks--if not in the exchange-traded proxies, then perhaps in basic materials stocks that have managed to remain above the 50-day EMA (unlike both IYM and XLB, which are below that level). Such stocks include Air Products and Chemicals, Valspar Corp., and Monsanto (Figure 3). |
Technical Writer for Technical Analysis of STOCKS & COMMODITIES magazine, Working-Money.com, and Traders.com Advantage.
| Title: | Technical Writer |
| Company: | Technical Analysis, Inc. |
| Address: | 4757 California Avenue SW |
| Seattle, WA 98116 | |
| Phone # for sales: | 206 938 0570 |
| Fax: | 206 938 1307 |
| Website: | www.Traders.com |
| E-mail address: | DPenn@traders.com |
Traders' Resource Links | |
| Charting the Stock Market: The Wyckoff Method -- Books | |
| Working-Money.com -- Online Trading Services | |
| Traders.com Advantage -- Online Trading Services | |
| Technical Analysis of Stocks & Commodities -- Publications and Newsletters | |
| Working Money, at Working-Money.com -- Publications and Newsletters | |
| Traders.com Advantage -- Publications and Newsletters | |
| Professional Traders Starter Kit -- Software | |
Click here for more information about our publications!
Comments
Date: 06/11/05Rank: 3Comment:

Request Information From Our Sponsors
- VectorVest, Inc.
- Executive Premier Workshop
- One-Day Options Course
- OptionsPro
- Retirement Income Workshop
- Sure-Fire Trading Systems (VectorVest, Inc.)
- Trading as a Business Workshop
- VectorVest 7 EOD
- VectorVest 7 RealTime/IntraDay
- VectorVest AutoTester
- VectorVest Educational Services
- VectorVest OnLine
- VectorVest Options Analyzer
- VectorVest ProGraphics v6.0
- VectorVest ProTrader 7
- VectorVest RealTime Derby Tool
- VectorVest Simulator
- VectorVest Variator
- VectorVest Watchdog
- StockCharts.com, Inc.
- Candle Patterns
- Candlestick Charting Explained
- Intermarket Technical Analysis
- John Murphy on Chart Analysis
- John Murphy's Chart Pattern Recognition
- John Murphy's Market Message
- MurphyExplainsMarketAnalysis-Intermarket Analysis
- MurphyExplainsMarketAnalysis-Visual Analysis
- StockCharts.com
- Technical Analysis of the Financial Markets
- The Visual Investor
