HOT TOPICS LIST
- MACD
- Fibonacci
- RSI
- Gann
- ADXR
- Stochastics
- Volume
- Triangles
- Futures
- Cycles
- Volatility
- ZIGZAG
- MESA
- Retracement
- Aroon
INDICATORS LIST
LIST OF TOPICS
PRINT THIS ARTICLE
by David Penn
A diamond continuation pattern leads the way higher in this medical equipment provider.
Position: N/A
David Penn
Technical Writer for Technical Analysis of STOCKS & COMMODITIES magazine, Working-Money.com, and Traders.com Advantage.
PRINT THIS ARTICLE
THE DIAMOND
Diamonds Up
06/10/05 08:21:07 AMby David Penn
A diamond continuation pattern leads the way higher in this medical equipment provider.
Position: N/A
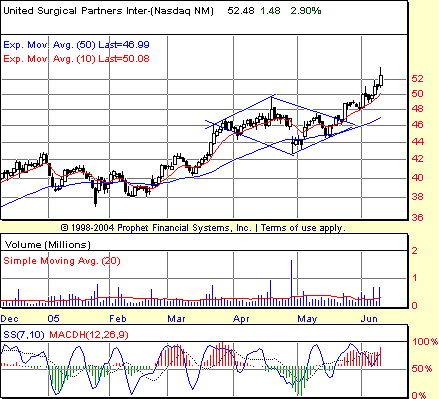
| I first spotted this diamond continuation pattern back when it was just a diamond consolidation. Specifically, the date was May 18, and USPI's diamond pattern had just been completed. All that was necessary was the break--to the upside or downside. |
| Many times, the direction of breakouts can be anticipated. I've written about a number of these instances in Traders.com Advantage, and many of these "anticipations" were courtesy of stochastic divergences. |

|
| Figure 1: After surviving a bearish scare--courtesy of a negative stochastic divergence--shares of USPI moved on to complete a diamond pattern over the next few weeks. |
| Graphic provided by: Prophet Financial, Inc. |
| |
| This was not the case with this diamond consolidation, which, perched upon the support of the 10- and 50-day exponential moving averages (EMAs), did not feature the sort of, for example, positive stochastic divergence that would have anticipated the potential for an upside break. In fact, if stochastic divergences had been hinting at anything, it might have been weakness. Note how the April high in USPI is higher than the March high. However, the 7,10 stochastic was higher in late March than it was in mid-April. This was actually a negative divergence and appears to have anticipated the late April correction, a correction that clipped two points off of USPI in a day. |
| The correction, nevertheless, did not turn out to be a reversal. Instead, prices climbed back above the 50-day EMA as the right side of the diamond pattern began to take form. At this point, while the bearishness of the recent negative stochastic divergence was no doubt still present, bears were required to give the benefit of the doubt to a stock that had taken the negative stochastic divergence smackdown and lived to tell the tale--on the bull's side of the 50-day EMA. The fortunate thing about the diamond consolidation is that it helps the bears mark a point beyond which they could feel comfortable about the downside risks. Just because USPI avoided one negative stochastic divergence meltdown didn't mean that it couldn't succumb to another. And a close beyond the lower right-hand side of the diamond consolidation would have provided ample opportunity for USPI to do just that. |
| On the flip side, of course, a close beyond the upper right-hand side of the diamond pattern would signify the opportunity for a real breakout--which is precisely what occurred on May 23 on increasing volume (note the downward volume trend leading to the breakout). With a formation size between five and seven points (depending on whether the extended tails or shadows on April 19 and 28 are included) and a breakout at about 46, the diamond continuation suggested an upside to anywhere between 51 and 53, which, interestingly enough, is where USPI shareholders find themselves right now. |
Technical Writer for Technical Analysis of STOCKS & COMMODITIES magazine, Working-Money.com, and Traders.com Advantage.
| Title: | Technical Writer |
| Company: | Technical Analysis, Inc. |
| Address: | 4757 California Avenue SW |
| Seattle, WA 98116 | |
| Phone # for sales: | 206 938 0570 |
| Fax: | 206 938 1307 |
| Website: | www.Traders.com |
| E-mail address: | DPenn@traders.com |
Traders' Resource Links | |
| Charting the Stock Market: The Wyckoff Method -- Books | |
| Working-Money.com -- Online Trading Services | |
| Traders.com Advantage -- Online Trading Services | |
| Technical Analysis of Stocks & Commodities -- Publications and Newsletters | |
| Working Money, at Working-Money.com -- Publications and Newsletters | |
| Traders.com Advantage -- Publications and Newsletters | |
| Professional Traders Starter Kit -- Software | |
Click here for more information about our publications!
Comments
Date: 06/11/05Rank: 3Comment:

Request Information From Our Sponsors
- VectorVest, Inc.
- Executive Premier Workshop
- One-Day Options Course
- OptionsPro
- Retirement Income Workshop
- Sure-Fire Trading Systems (VectorVest, Inc.)
- Trading as a Business Workshop
- VectorVest 7 EOD
- VectorVest 7 RealTime/IntraDay
- VectorVest AutoTester
- VectorVest Educational Services
- VectorVest OnLine
- VectorVest Options Analyzer
- VectorVest ProGraphics v6.0
- VectorVest ProTrader 7
- VectorVest RealTime Derby Tool
- VectorVest Simulator
- VectorVest Variator
- VectorVest Watchdog
- StockCharts.com, Inc.
- Candle Patterns
- Candlestick Charting Explained
- Intermarket Technical Analysis
- John Murphy on Chart Analysis
- John Murphy's Chart Pattern Recognition
- John Murphy's Market Message
- MurphyExplainsMarketAnalysis-Intermarket Analysis
- MurphyExplainsMarketAnalysis-Visual Analysis
- StockCharts.com
- Technical Analysis of the Financial Markets
- The Visual Investor
