HOT TOPICS LIST
- MACD
- Fibonacci
- RSI
- Gann
- ADXR
- Stochastics
- Volume
- Triangles
- Futures
- Cycles
- Volatility
- ZIGZAG
- MESA
- Retracement
- Aroon
INDICATORS LIST
LIST OF TOPICS
PRINT THIS ARTICLE
by Koos van der Merwe
The Elliott wave theory is simply that: a theory--and yet so many analysts swear by it. ...
Position: N/A
Koos van der Merwe
Has been a technical analyst since 1969, and has worked as a futures and options trader with First Financial Futures in Johannesburg, South Africa.
PRINT THIS ARTICLE
ELLIOTT WAVE
The Nasdaq And Three Elliott Wave Counts
06/10/05 08:11:26 AMby Koos van der Merwe
The Elliott wave theory is simply that: a theory--and yet so many analysts swear by it. ...
Position: N/A
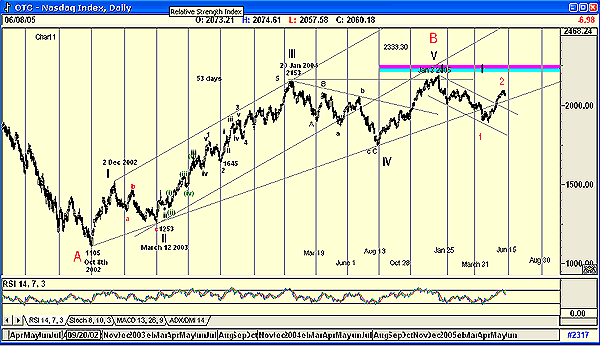
| My first foray into technical analysis was via a book explaining point and figure charts by A.W. Cohen. My second foray was with A.J. Frost and Robert Prechter's book on Elliott wave theory. Both served me well over the years, but I also learned that neither was the holy grail. Today, I use P&F for target analysis, and I use Elliott wave as a signpost to tell me where I am in the wilderness of the stock market. Here are three charts of the Nasdaq index. All are identical, with the exception of the wave count. Which count is correct will be decided over the coming weeks. From October 8, 2002, all the charts are identical. From that point on, the rise to 2153 on January 20, 2004, offers two different counts. Figure 1 suggests that the count could be the elusive B-wave the market is looking for. B-waves are notorious bull traps, and are followed by an impulse C-wave down. This means that the C-wave will fall in five waves to depths where "the blood is running in the streets," a reference to the brokers who jumped to their deaths after the market crash of October 1929. |

|
| Nasdaq Figure 1 |
| Graphic provided by: AdvancedGET. |
| |
| Figure 1 suggests that the B-wave is complete, and that wave I and wave II are complete, with minor waves 1 and 2 of wave III down in progress. The only problem with this count, which I must admit does look very convincing, is that a wave 1 is always an impulse wave--that is, it should be five waves, not the corrective ABC wave shown. |

|
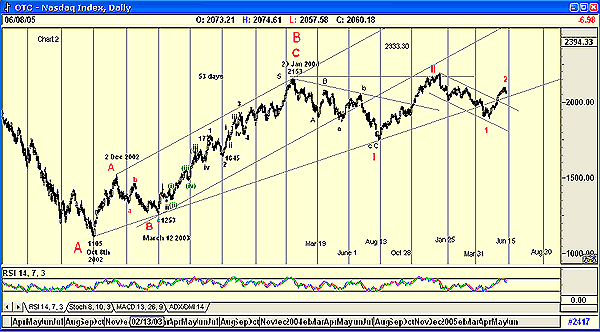
| Nasdaq Figure 2 |
| Graphic provided by: AdvancedGET. |
| |
| This caused me to attempt a second count, as shown in Figure 2. In this chart I have shown the B-wave as a five-wave impulse wave up, ending on January 20, 2005. I have also shown waves 1 and 2 of the C-wave down, with wave 3 probably having started. I say probably, because at the moment wave 2 is a simple wave, which could become complicated--that is, an a-b-c up movement. The problem with this count is that in all my years as a technician, I have never seen a B-wave that is a five-wave impulse wave. I have seen a B-wave as an a-b-c correction, with wave c as a five-wave impulse wave. Because of this, the pattern shown on the chart disturbed me. |

|
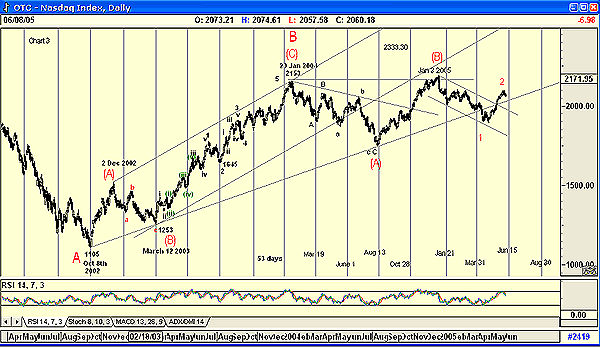
| Nasdaq Figure 3 |
| Graphic provided by: AdvancedGET. |
| |
| For this reason I developed Figure 3, very similar to Figure 2 in that it is also showing the start of a wave 3 down, but with the difference being that it is a wave 3 of a wave C, and that only if the wave 2 down is a simple wave, not an a-b-c complicated wave. Whatever the correct count, the charts are telling us that market direction could be short term up and long term down. With a cycle low expected on June 15, we could very likely see a correction in wave 2 to meet this cycle low, with a high--the end of wave 2 up somewhere in between June 15 and August 30. Enjoy. |
Has been a technical analyst since 1969, and has worked as a futures and options trader with First Financial Futures in Johannesburg, South Africa.
| Address: | 3256 West 24th Ave |
| Vancouver, BC | |
| Phone # for sales: | 6042634214 |
| E-mail address: | petroosp@gmail.com |
Click here for more information about our publications!
Comments
Date: 06/11/05Rank: 2Comment:

Request Information From Our Sponsors
- StockCharts.com, Inc.
- Candle Patterns
- Candlestick Charting Explained
- Intermarket Technical Analysis
- John Murphy on Chart Analysis
- John Murphy's Chart Pattern Recognition
- John Murphy's Market Message
- MurphyExplainsMarketAnalysis-Intermarket Analysis
- MurphyExplainsMarketAnalysis-Visual Analysis
- StockCharts.com
- Technical Analysis of the Financial Markets
- The Visual Investor
- VectorVest, Inc.
- Executive Premier Workshop
- One-Day Options Course
- OptionsPro
- Retirement Income Workshop
- Sure-Fire Trading Systems (VectorVest, Inc.)
- Trading as a Business Workshop
- VectorVest 7 EOD
- VectorVest 7 RealTime/IntraDay
- VectorVest AutoTester
- VectorVest Educational Services
- VectorVest OnLine
- VectorVest Options Analyzer
- VectorVest ProGraphics v6.0
- VectorVest ProTrader 7
- VectorVest RealTime Derby Tool
- VectorVest Simulator
- VectorVest Variator
- VectorVest Watchdog
